Price analysis, June 9 to 15: Bitcoin, Ethereum, Ripple, Bitcoin Cash, EOS, Litecoin, Cardano, Stellar, IOTA

Earlier this year, analysts were very optimistic about Bitcoin and were projecting high targets for 2018. Many did not revise their lower target even after the sharp fall of January this year because they expected a strong rebound from the lows.
Fast forward to June, analysts are concerned about the lack of momentum, resulting in a downward revision in target prices.
In January, the Finder price comparison site had reached a year-end price of $ 33,000 in Bitcoin after compiling the forecasts of a panel of experts in cryptocurrencies. This week, Finder reduced the target price to $ 14 638 by the end of 2018.
The Trefis stock analysis firm is also not very "optimistic" about the outlook for a strong rebound in Bitcoin prices this year. It reduced its year-end price forecast from $ 15,000 to $ 12,000. Both price forecasts still offer a decent advantage over current levels.
Probably, the change of game will be the entrance of institutional investors. Several companies are laying the groundwork to benefit from the influx of large amounts of money. The last one to join the cryptos commercialization car is the American trade and technology firm Susquehanna International Group, which will open the trading of Bitcoin futures for a small group of its 500 clients.
So, is this the right time to buy? Let's see.
BTC / USD
The 20-day EMA is proving to be a big obstacle for Bitcoin. Today, the price has dropped once more. Both the moving averages and the RSI are falling, which is a negative sign. If the immediate support in the small trend line breaks, the digital currency may fall to $ 7,433, $ 7,317 and $ 7,100.
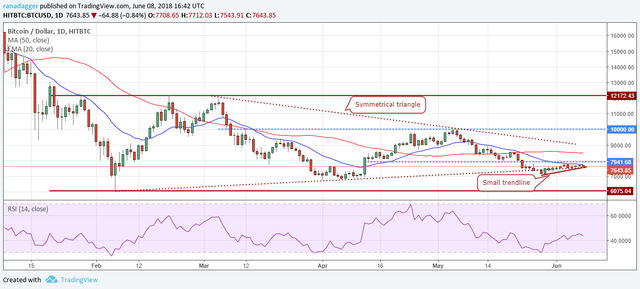
The first signs of recovery will be when the BTC / USD pair explodes and remains above the 20-day EMA. The confirmation of a change in the short-term trend will be in a break and close above $ 7 941.68.
We continue to hold the view that the wide range between $ 6 075- $ 12 172 is still at stake. Therefore, traders should expect a break above $ 7 941.68 or a drop closer to $ 6,500 to start long positions.
ETH / USD
Ethereum did not trigger our purchase levels at $ 630, suggested in the previous analysis. It has been rejected with respect to the 20 day EMA and has broken the support of the trend line. He is currently trying to stay above the resistance line of the descending channel. If this support breaks and re-enters the channel, it can slip to $ 540.
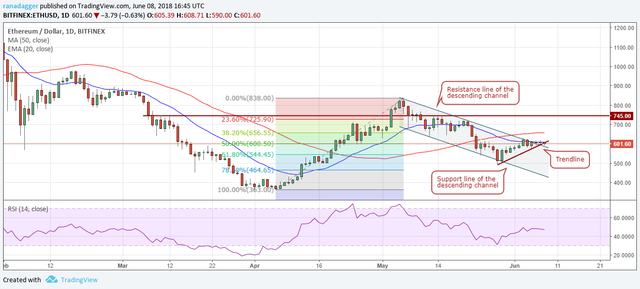
The 50-day SMA is increasing while the 20-day EMA is flat. If the bulls manage to maintain the channel's resistance line and push prices above $ 630, it will indicate strength. Therefore, we keep our purchase recommendation provided in the previous analysis.
After starting long positions, if the ETH / USD pair struggles to exit the 50-day SMA, operators can raise the stops to break-even.
XRP / USD
Ripple has kept the EMA for 20 days during the last five days, but has not been able to move forward. It has been operating in a small range for the last two days. Both moving averages are flat, which confirms consolidation in the short term.
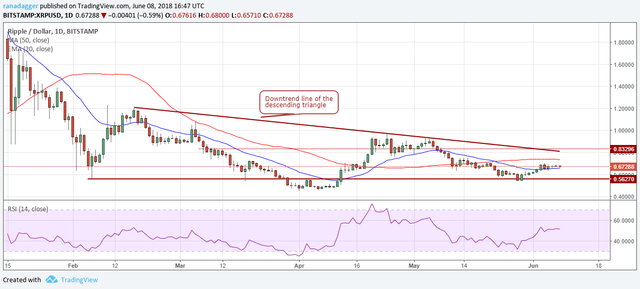
The probable range is between $ 0.633 and $ 0.75. A break of $ 0.633 can sink the XRP / USD pair to levels of $ 0.56, while a break above $ 0.75 can take it to the downtrend line of the falling triangle.
The digital currency will turn bullish if it breaks and stays above the downtrend line of the downward triangle. We did not find any purchase settings at the current levels; therefore, we are not suggesting any exchange in this.
BCH / USD
Bitcoin Cash remained above the 20-day EMA for the past two days, but bears are trying to push prices below the 20-day EMA at present. The short-term moving average is flat, while the long-term moving average is rising. The RSI also turned flat near the middle line. This increases the likelihood of consolidation in the short term.
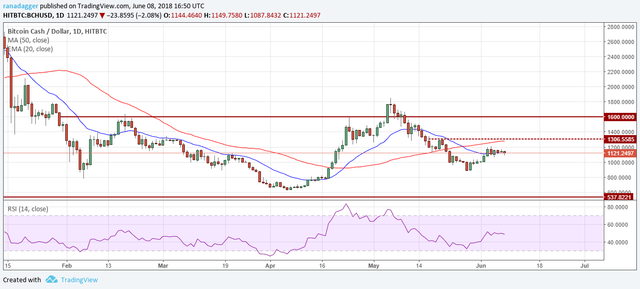
A break below $ 1 060 will tip the advantage in favor of the bearish, while a break of the levels of $ 1 306 indicates bullish advantage.
The BCH / USD pair periodically enters such small ranges before taking off or descending strongly. We will wait for a confirmation of the beginning of the upward movement before recommending any long position in it.
EOS / USD
EOS activated our purchase recommendation specified in the previous analysis when it closed above the 50-day SMA. However, the optimism was ephemeral, as it has dropped drastically today, giving up most achievements
from the previous day.
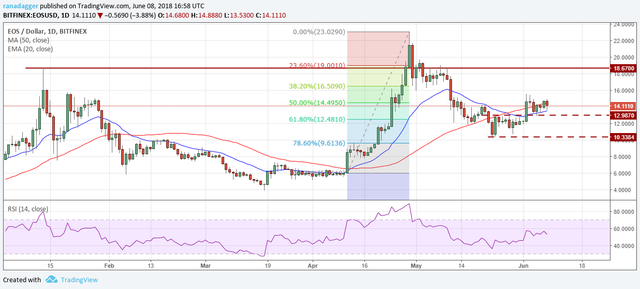
EOSThe EOS / USD pair has a strong support zone between the 20-day EMA and $ 12,987. If this support zone is broken, the cryptocurrency will become negative and will slide to $ 12 and below that, to $ 10.3384. Therefore, we have suggested keeping the loss minimization point close to the $ 12.5 levels. As the support zone is just below current levels, we suggest keeping the long positions with the designated loss minimization point. We're still not bailing out of the position because moving averages are rising and the price has not yet broken below the 20-day EMA.
LTC / USD
Litecoin has not managed to climb above the $ 127 levels, therefore, our recommendation The purchase price provided in the previous analysis was not activated. There is strong support at $ 115. If the support is maintained, the digital currency could consolidate in a narrow range for a few days, before going up or down from it. A breakdown below $ 107 will complete the bearish downward triangle pattern, which is a negative sign.
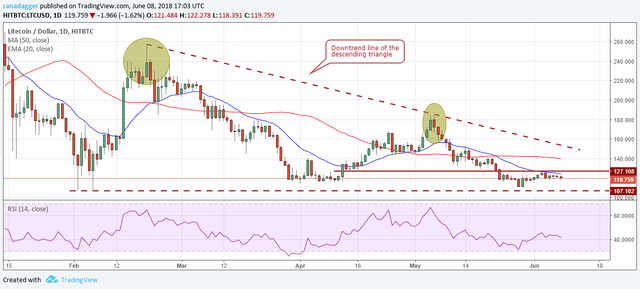
Although the objectives of the pattern are much lower, the LTC / USD pair can easily decrease to $ 84,708. The cryptocurrency will gain strength in the short term once it explodes and stays above $ 127. It will be completely out of danger once it leaves the downtrend line of the downward triangle. We did not find any purchase settings at current levels; therefore, we suggest that traders remain on the sidelines.
ADA/ USD
After not being able to exit and close (UTC) above $ 0.23, Cardano has rejected. The 20-day EMA, which had stagnated, began to decline, which is a negative sign.
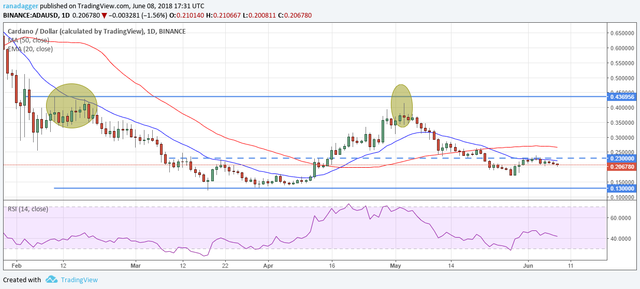
ADA / USD can now fall to $ 0.17, which is lower support. If this level is also broken, the next support to the downside is $ 0.13. We could buy levels close to $ 0.13 because we expect the digital currency to remain in a wide range of $ 0.13- $ 0.436956. We will wait for the purchase to return before suggesting a trade in it.
XLM / USDThe long position recommended by us in Stellar is currently at a loss. On June 7, the bulls could not stay above the superior resistance of $ 0.303. Currently, the price is being withdrawn. A failure to maintain the levels of $ 0.27 can extend the fall to $ 0.25, therefore, we have raised the stops in our previous analysis. The 20-day EMA has dropped slightly, increasing the probability of a fall.
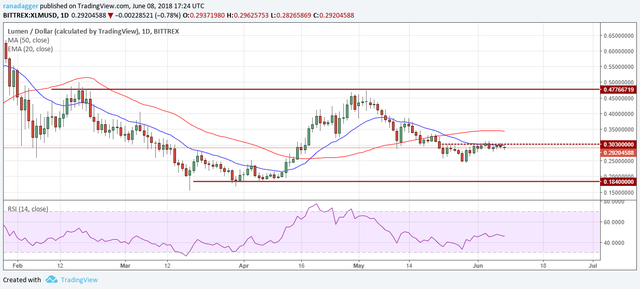
However, as the pair XLM / USD has risen from levels slightly higher than $ 0.27 on three occasions, we want to hold the positions for a couple of days more. The digital currency will gain strength if the bulls manage to go up and hold levels above $ 0.303.
IOTA / USDIOTA has remained at the critical support level of $ 1.63 over the past three days, but it is difficult to get a strong rebound. This increases the possibility of a fall below $ 1,63.IOTASi the pair
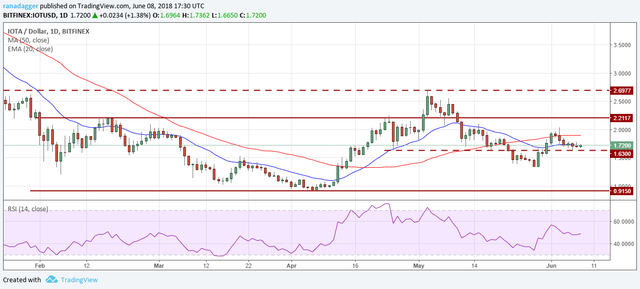
IOTA / USD breaks below $ 1.63, will become negative and can slip to $ 1.33, which is your next support. If the $ 1.33 level also breaks, the drop can extend to $ 0.9150. Our bearish view will be invalidated if the bulls have $ 1.63 and cause a strong rebound from there.
Sources and images:
https://es.tradingview.com/symbols/BTCUSD/
https://cryptagio.com/?gclid=EAIaIQobChMI19LuscPG2wIVCFuGCh1xDw8XEAAYAiAAEgJx3vD_BwE
https://es.investing.com/crypto/bitcoin/analysis
Resteemed your article. This article was resteemed because you are part of the New Steemians project. You can learn more about it here: https://steemit.com/introduceyourself/@gaman/new-steemians-project-launch