Cryptocurrency and ICO Market Analysis [March 19-25, 2018]


This report presents data on the cryptocurrency and ICO market changes during 2017-2018. Special emphasis has been placed on an analysis of the changes that have taken place in March 2018, including over the last week (March 19-25, 2018).
Information as of March 26, 2018
Professor Dmitrii Kornilov, Doctor of Economics, Member of the Russian Academy of Natural Sciences, and Leading Analyst at ICOBox
Dima Zaitsev, PhD in Economics, Head of International Public Relations and Business Analytics Department Chief at ICOBox
Nick Evdokimov , Co-Founder of ICOBox
Mike Raitsyn , Co-Founder of ICOBox
Anar Babaev , Co-Founder of ICOBox
Daria Generalova, Co-Founder of ICOBox
Cryptocurrency Market Analysis (March 19-25, 2018)
1. General cryptocurrency and digital assets market analysis (by week, month, quarter). Market trends.
1.1.General cryptocurrency and digital assets market analysis (by week, month).
1. General cryptocurrency and digital assets market analysis (by week, month, quarter). Market trends.
1.1.General cryptocurrency and digital assets market analysis (by week, month).
Table 1.1. Trends in capitalization of the cryptocurrency market and main cryptocurrencies from February 1, 2017, to March 25, 2018
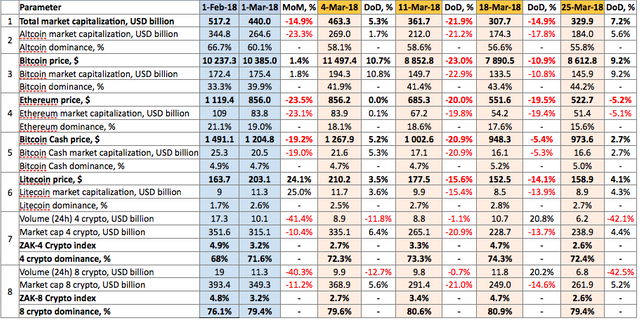

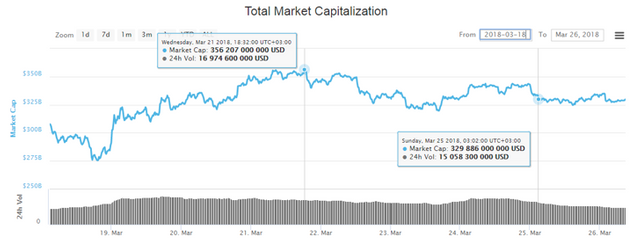
Over the past week cryptocurrency market capitalization increased, and equaled $329.9 billion as of 03:00 UTC on March 25 (see Table 1.1, fig. 1).
The dominance of the four and eight largest cryptocurrencies as of 03:00 UTC on March 25, 2018, equaled 72.4% and 79.4%, respectively, with bitcoin dominance increasing to 44.2% (see Table 1.1), i.e. one can conclude that altcoins have depreciated more significantly since the beginning of March than the leader of the cryptocurrency market.
Early in the week the news broke that Snap Inc. had banned advertising of initial coin offerings (ICO) on the mobile messenger Snapchat. Information also surfaced that Twitter also intends to ban all advertising related to the crypto industry, following in the footsteps of Facebook (including the Audience Network and Instagram platforms) and Google.
Despite this fact, a growth in capitalization from $275 billion to $356.2 billion, i.e. by more than $80 billion, was seen from March 18-21 (see fig. 1). This was due to the favorable impact of the discussion of regulation of the crypto industry at the G20 summit, which was held on March 19-20. In particular, at a meeting of the finance ministers and directors of the central banks of the G20 member states the head of the Financial Stability Board (FSB) Mark Carney stated that cryptocurrencies do not pose risks to global financial stability.
By the end of the week, however, a small downward adjustment to the level of $325-340 billion had already taken place (fig. 1) under the influence of certain negative news items (see Table 1.4), with trading volumes also falling (Table 1.5).
Figure 1. Cryptocurrency market capitalization since March 18, 2018
Overall, during the period from March 19-25, 2018, the price of 411 of the top 500 cryptocurrencies and digital assets appreciated, resulting in a growth in cryptocurrency market capitalization by more than $30 billion.
Over the past week the number of cryptocurrencies with a capitalization of more than $1 billion increased from 18 to 24, with the price of all of them rising except VeChain (-4.59%) and Lisk (-0.43%).
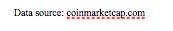
The coins and tokens from the top 100 that demonstrated the largest growth in prices are given in fig. 2.
The growth and fall of cryptocurrency prices over the past week (March 19-25, 2018)
The prices of some cryptocurrencies may fluctuate from -50% to +50% over the course of a single day. Therefore, when analyzing cryptocurrency price trends, it is advisable to use their average daily amounts on various cryptoexchanges.
Below we consider the top 10 cryptocurrencies that demonstrated the most significant change in price over the past week (fig. 2-3). In this regard, only those coins and tokens included in the top 100 and top 200 in terms of market capitalization (according to the data of coinmarketcap.com) were considered.
Figure 2. Largest growth in prices over the past week
Tables 1.2 and 1.3 show the possible factors or events that might have influenced the fluctuation in prices for certain cryptocurrencies. Table 1.4 shows the possible factors or events that might have influenced the cryptocurrency market in general.
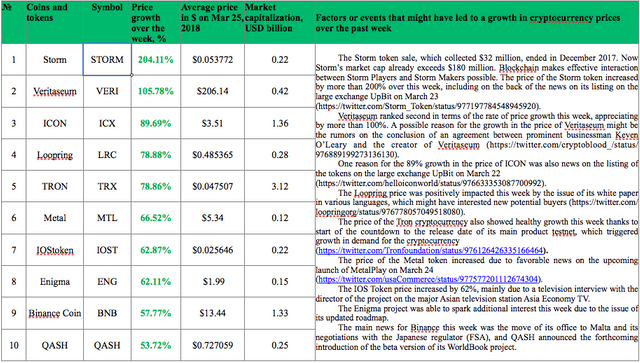
Table 1.2. Factors or events that might have led to a growth in cryptocurrency prices over the past week
A depreciation in price was seen for 89 coins and tokens of the top 500 cryptocurrencies and digital assets by capitalization over the past week. The ten cryptocurrencies from the top 200 that showed the most noticeable drops in price are shown in fig. 3.
Figure 3. Largest fall in prices over the past week
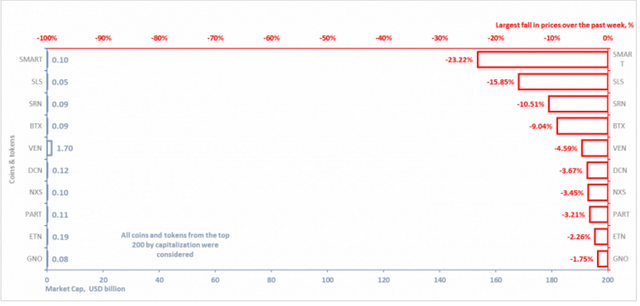
Table 1.3. Factors or events that might have led to a fall in cryptocurrency prices over the past week
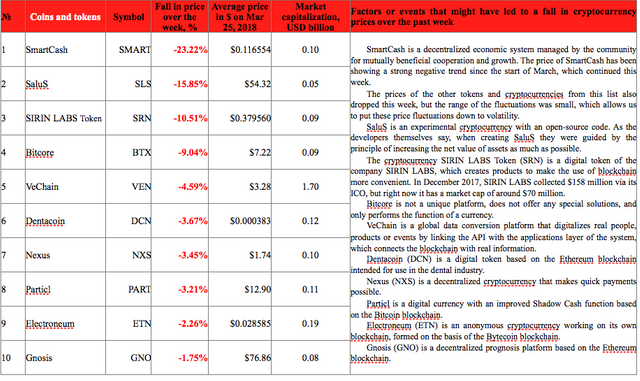
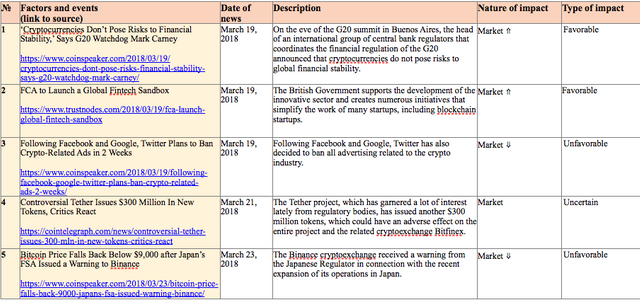
Table 1.4 shows events that took place from March 19-25, 2018, and had an impact on both the prices of the dominant cryptocurrencies and the market in general, with an indication of their nature and type of impact.
Table 1.4. Key events of the week having an influence on cryptocurrency prices, March 19-25, 2018
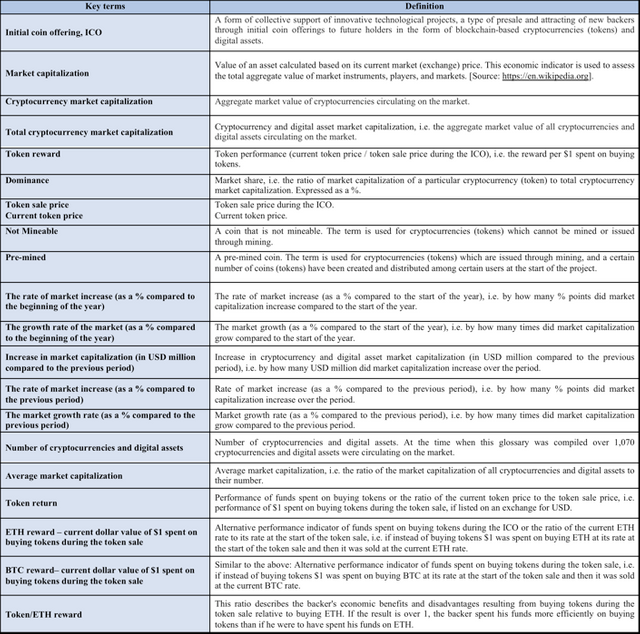
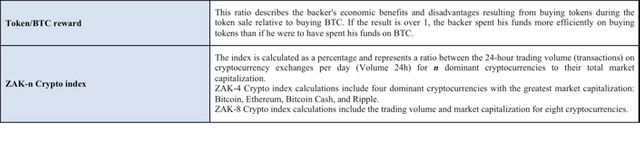
To analyze trading activity on cryptocurrency exchanges, the ZAK-n Crypto index is calculated (see the Glossary). The values of the ZAK-4 Crypto and ZAK-8 Crypto indices are presented in Tables 1.1, 1.5.a, and 1.5.b. In March the 24-hour trading volumes (Volume 24h) for the four dominant cryptocurrencies (Bitcoin, Ethereum, Bitcoin Cash, Ripple) equaled from $7.7 billion to $12.4 billion (Table 1.5.a). The value of the daily ZAK-4 Crypto fluctuated from 2.7% to 4.7% of capitalization. The highest trading volume (up to 4.7%) was seen on March 18 on the eve of the G20 summit.
Table 1.5.a. Daily ZAK-4 Crypto index calculation (from March 1, 2018, to March 25, 2018)
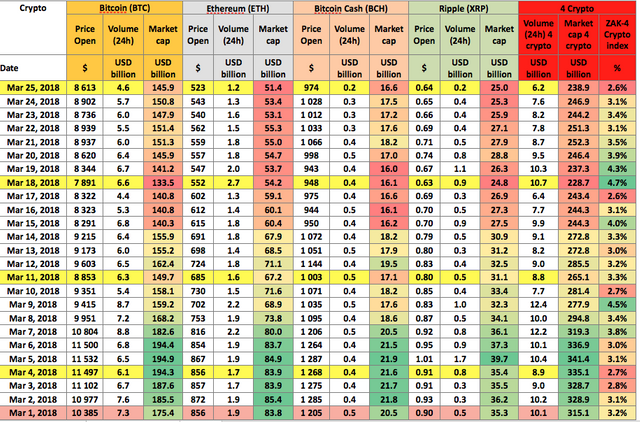
The 24-hour trading volumes (Volume 24h) for the eight dominant cryptocurrencies (Bitcoin, Ethereum, Bitcoin Cash, Ripple, Litecoin, Stellar, EOS, and Cardano) equaled $6.8 billion by the end of last week (Table 1.5.b), i.e. 2.6% of their market capitalization, which attests to a fall in activity on cryptoexchanges. The ZAK-4 Crypto and ZAK-8 Crypto indices are considered in more detail in Tables 1.5.a and 1.5.b.
Table 1.5.b. Daily ZAK-8 Crypto index calculation (continuation of Table 1.5.а)
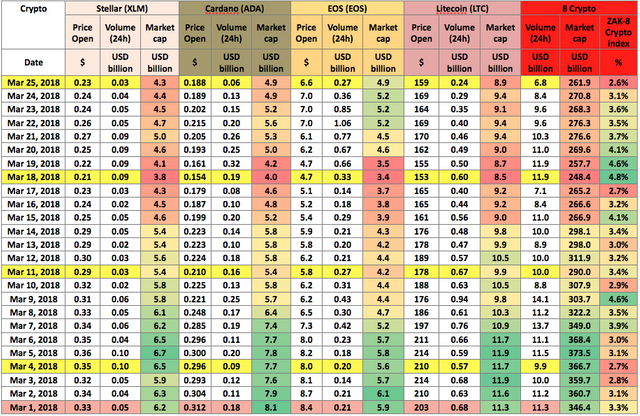
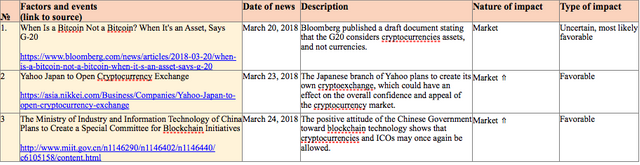
Table 1.6 gives a list of events, information on which appeared last week, which could impact both the prices of specific cryptocurrencies and the market in general.
Table 1.6. Events that could have an influence on cryptocurrency prices in the future
1.2. Market trends
The weekly cryptocurrency and digital asset market trends from October 1, 2017, to March 25, 2018, are presented as graphs (Fig. 1.1-1.5)*.
Table 1.7. Legends and descriptions of the graphs
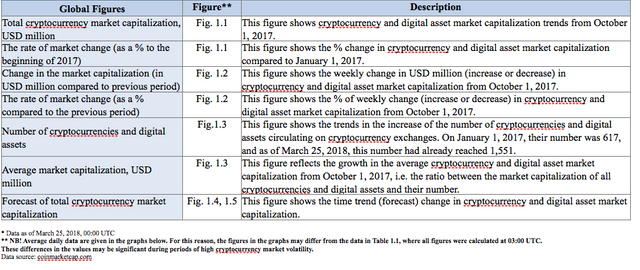
Figure 1.1. Total cryptocurrency market capitalization
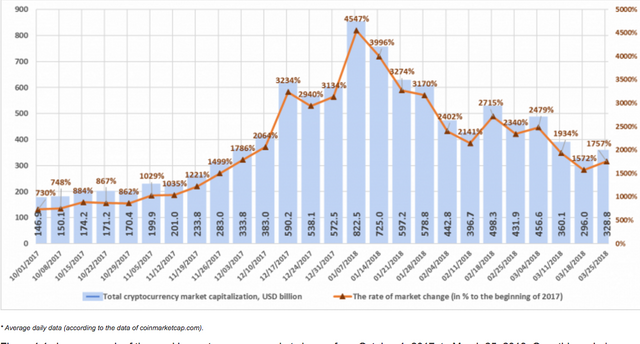
Figure 1.1 shows a graph of the weekly cryptocurrency market change from October 1, 2017, to March 25, 2018. Over this period, market capitalization increased from $146.9 billion to $328.8 billion, a growth of 1,757% compared to the start of 2017. Therefore, everyone who entered the cryptocurrency market in early 2017 was able to receive high returns due to market growth. However, the fall over the period from January 7, 2018, equaled $500 billion. Last week (March 19-25, 2018) cryptocurrency market capitalization increased from $296 billion to $328.8 billion (as of March 25, 2018, based on the average figures from coinmarketcap.com).
Figure 1.2. Change in market capitalization
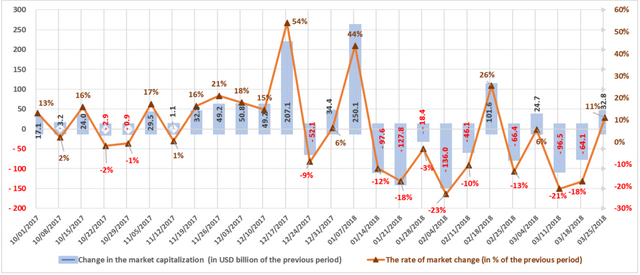
The market is susceptible to sudden and drastic fluctuations. The highest growth rate in Q4 2017 (December 17-24, 2017) was around $200 billion, or 54%. During the first week of January, market capitalization increased by approximately $250 billion, or 44%.
Already, eight of the first twelve weeks in the first quarter of 2018 have been “in the red”, i.e. capitalization fell based on the results of each of these weeks. Last week the market grew by $32.8 billion, or 11% (with due account of average daily data, see fig. 1.2).
Figure 1.3. Number of cryptocurrencies and digital assets
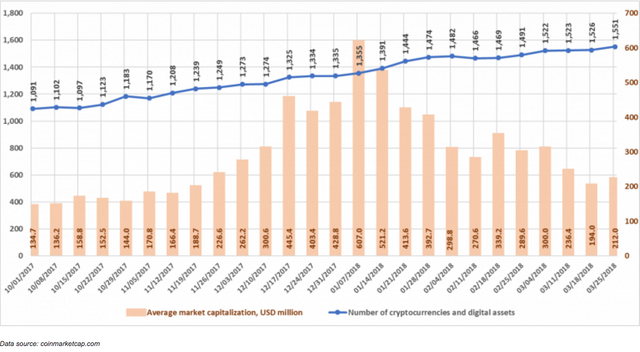
Since the beginning of October 2017, the total number of cryptocurrencies and digital assets considered when calculating market capitalization has increased from 1,091 to 1,551. Their number increased by 25 from 1,526 to 1,551 over the last week, and average capitalization equaled $212 million. Over the past month, 69 new coins and tokens have appeared on coinmarketcap.com, but it should be noted that a number of other coins and tokens were also excluded from the list.
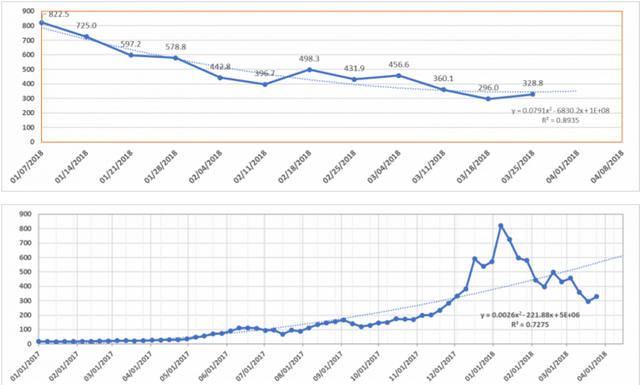
Figures 1.4 and 1.5. Forecast of total cryptocurrency market capitalization
A positive trend for the cryptocurrency market as a whole could be seen last week, as well as a partial change in the synchronicity of the rise and fall of the prices of a number of coins and tokens.
Banks are paying ever closer attention to blockchain technology, and even considering the possibility of purchasing cryptoexchanges. For example, Barclays Bank purchased the Coinbase cryptoexchange, and Circle purchased the Poloniex cryptoexchange (Goldman Sachs Bank is an investor in Circle). On the one hand, the perception of the cryptocurrency market as a competitor to the banking industry is gradually being replaced with the recognition of the possibilities for partnership, the development of new innovative technologies and new types of services. On the other hand, the influence of the banks might lead to a reduction in the decentralization of currency flows.
At the G20 summit in Buenos Aires, the head of the Financial Stability Board (FSB) announced that cryptocurrencies do not pose risks to global financial stability. This positive attitude could lead to another cycle of influx of financial assets to the crypto industry from institutional players, and therefore to a growth in capitalization over the medium term.
ICO Market Analysis (March 19-25, 2018)
1. General analysis of the ICO market (by week, month)
1.1. Brief overview of ICO market trends
1. General analysis of the ICO market (by week, month)
1.1. Brief overview of ICO market trends
Table 1.1. Brief ICO market overview, key events, news for the week of March 19-25, 2018
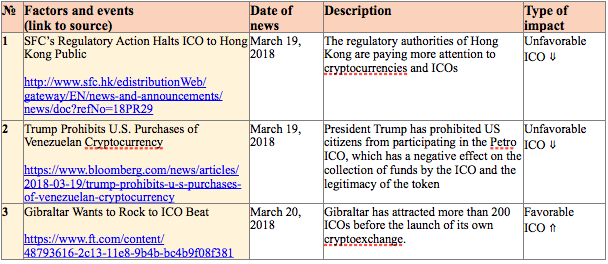
Table 1.2 shows the development trends on the ICO market since 2017. Only popular and/or successfully completed ICOs (i.e. ICOs which managed to collect the minimum declared amount of funds) and/or ICOs listed on exchanges were considered.
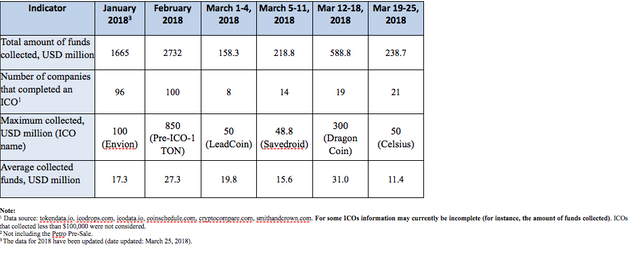
Table 1.2. Aggregated trends and performance indicators of past (completed) ICOs1,2
The data on the funds collected by the Petro Pre-Sale are not included in Table 1.2, since the information from different sources on total funds collected is fairly contradictory. The project’s website states that the Petro Pre-Sale reached more than 4,777 million yuan, or $735 million. Pursuant to the information from the white paper, if all the Petro tokens are sold at the Pre-Sale and the Initial Offer, the funds collected would equal around $4.3878 billion. The Initial Offer began on March 20.
The data for the previous week (March 12-18, 2018) were adjusted to account for the appearance of more complete information on past ICOs. The amount of funds collected via ICOs during the past week (March 19-25, 2018) equaled $238.7 million. This amount consists of the results of 21 successfully completed ICOs, with the largest amount of funds collected equaling $50 million (Celsius). The average collected funds per ICO project equaled 11.4 million (see Tables 1.2, 1.3).
Table 1.3. Amount of funds collected and number of ICOs
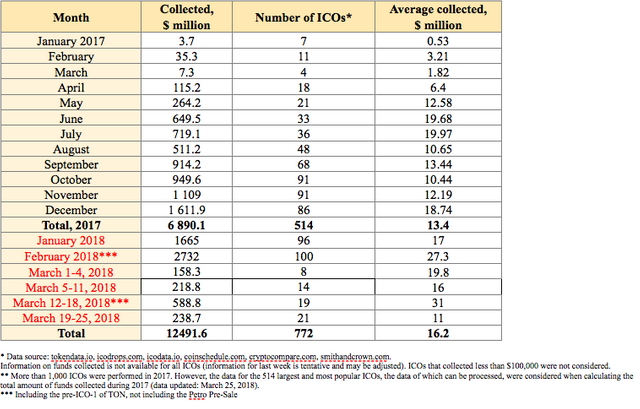
Table 1.3 shows that the largest amount of funds was collected via ICOs in February 2018. The highest average collected funds per ICO was also seen in February 2018.
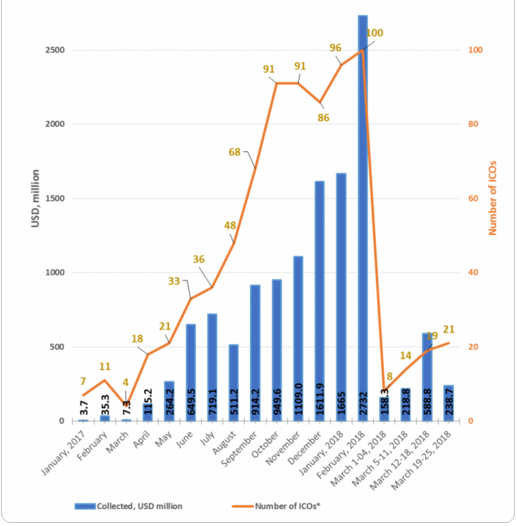
Figure 1.1. Trends in funds collected and number of ICOs since the start of 2017
1.2. Top ICOs of last week
Table 1.4 shows the ten largest ICOs of the week.
Table 1.4. Top 10 ICOs in terms of the amount of funds collected (March 19-25, 2018)
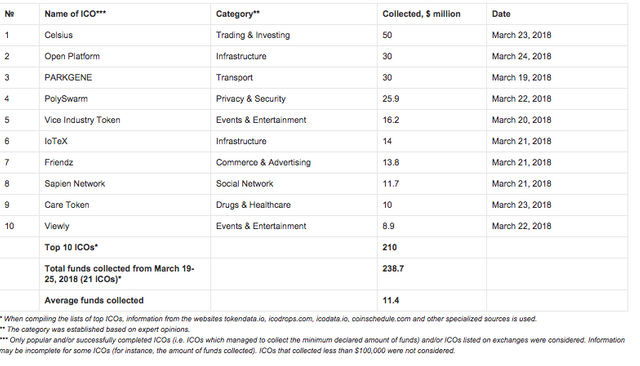
The data for last week (March 19-25, 2018) may be adjusted as information on the amounts of collected funds by completed ICOs is finalized.
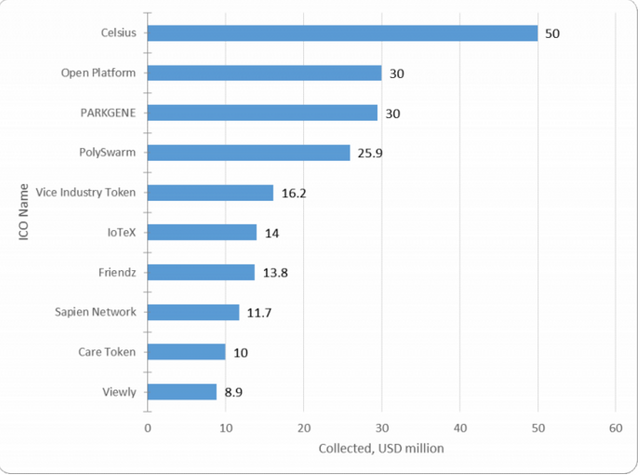
The leader for the week was the Celsius project. This is a financial P2P platform that focuses on relations between digital asset owners and borrowers, which allows the former to earn interest on their assets, and the latter to receive loans.
Figure 1.2 presents the ten largest ICOs completed last week. The FortKnoxster project, which already collected $15 million during its Pre-sale, can also be taken into account.
Figure 1.2. Top 10 ICOs in terms of the amount of funds collected (March 19-25, 2018)
1.3. Top ICOs in their categories
The list of top ICOs by category is compiled with due account of the categories of the leading ICOs for the week.
Table 1.5. Top 10 ICOs in terms of the amount of funds collected, Trading & Investing category
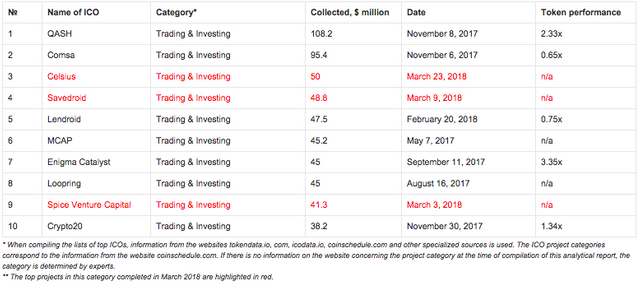
At present, all projects from the top 10 in this category have a token performance indicator of 0.65x to 3.35x. The Enigma Catalyst project can be considered one of the most successful exchange listings, as this project has a current token price to token sale price ratio of 3.35x. When considering this indicator, it is important to remember that the Enigma Catalyst ICO was completed on September 11, 2017, i.e. the 3.35x growth took place over approximately six months. The market capitalization of Enigma Catalyst currently exceeds $120 million.
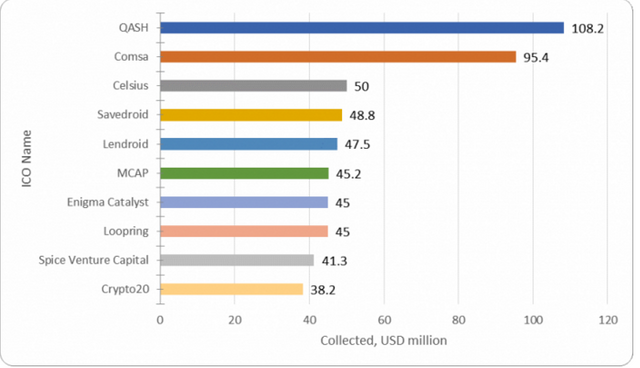
Figure 1.3. Top 10 ICOs in terms of the amount of funds collected, Trading & Investing category
The ICOs of three projects that can be assigned to the Privacy & Security category and are included in the top 10 of this category were also completed in March.
Table 1.6. Top 10 ICOs in terms of the amount of funds collected, Privacy & Security category
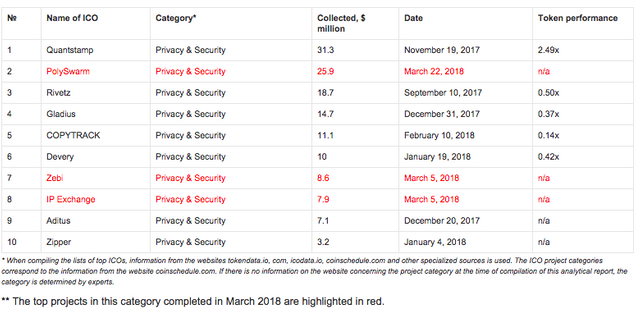
Most of the projects in this category have a token performance indicator of less than 1. The leader in the category, the Quantstamp project, has the highest funds collected and the best token performance indicator. Its market capitalization currently exceeds $75 million, and its token performance equals 2.49.
Figure 1.4. Top 10 ICOs in terms of the amount of funds collected, Privacy & Security category
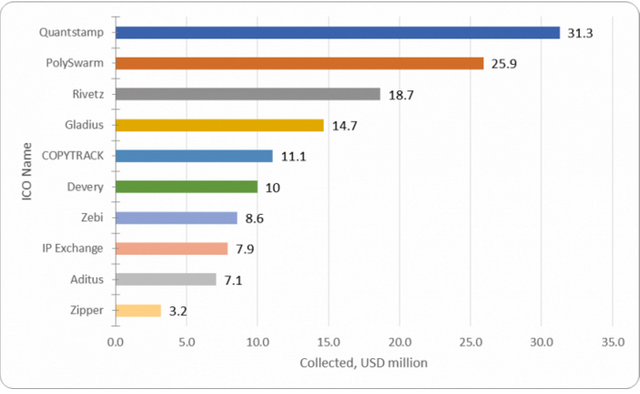
Table 1.7. Top 8 ICOs in terms of the amount of funds collected, Transport category
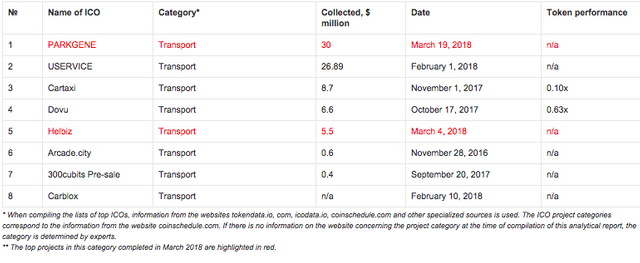
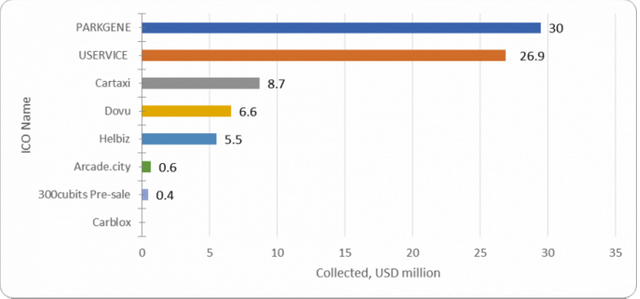
There is not enough information to draw any conclusions on the token performance of the projects in this category. The ICOs of four projects were completed in February and March 2018, and two projects included in the top 10 have a token performance indicator of less than 1.
Figure 1.5. Top 8 ICOs in terms of the amount of funds collected, Transport category
Last week (March 19-25, 2018) at least 21 ICO projects were successfully completed, each of which collected more than $100,000, with the total amount of funds collected equaling around $240 million. Last week’s leader was the Celsius project (collected $50 million). The total amount of funds collected by a number of ICOs failed to reach even the $100,000 mark (the information for some projects is still being finalized).
The Glossary is given in the Annex.
Annex
Glossary