Cryptocurrency and ICO Market Analysis (October 1-7, 2018)

This report presents data on cryptocurrency and ICO market changes during 2018. Special emphasis has been placed on an analysis of the changes that took place last week (October 1-7, 2018).
Information as of October 8, 2018
Professor Dmitrii Kornilov, Doctor of Economics, Member of the Russian Academy of Natural Sciences, and Leading Analyst at ICOBox
Dima Zaitsev, PhD in Economics, Head of International Public Relations and Business Analytics Department Chief at ICOBox
Nick Evdokimov , Co-Founder of ICOBox
Anar Babaev , Co-Founder of ICOBox
Daria Generalova, Co-Founder of ICOBox
Cryptocurrency Market Analysis (October 1-7, 2018)
General cryptocurrency and digital assets market analysis. Market trends
General cryptocurrency and digital assets market analysis
General cryptocurrency and digital assets market analysis. Market trends
General cryptocurrency and digital assets market analysis
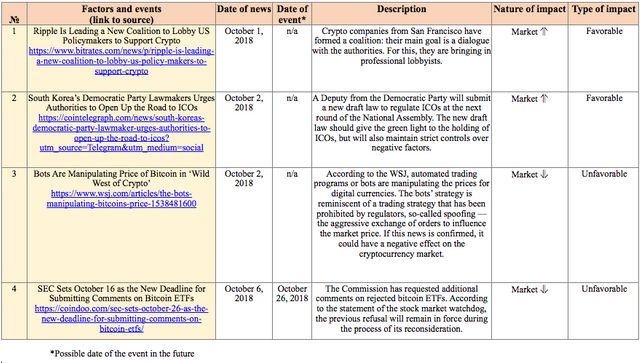
Table 1.1. Trends in capitalization of the cryptocurrency market and main cryptocurrencies from January 1, 2018, to October 7, 2018
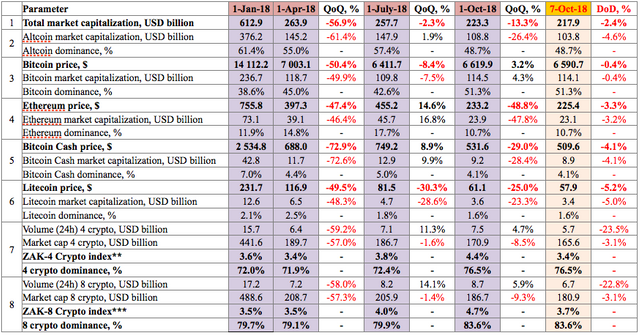

Cryptocurrency market capitalization decreased over the analyzed period (October 1-7, 2018), and as of 03:00 UTC equaled $217.9 billion (see Table 1.1). The dominance of the four and eight largest cryptocurrencies as at 03:00 UTC on October 7, 2018, equaled 76.7% and 83.6%, respectively, while bitcoin dominance equaled 51.3%. (see Table 1.1).
During the period from October 1-7, 2018, cryptocurrency market capitalization fluctuated from $213.9 billion (min) to $224.6 billion (max) (Fig. 1a), i.e. within a range of $10.7 billion. For its part, bitcoin capitalization fluctuated from $111.6 billion (min) to $115.1 billion (max), i.e. within a range of $3.5 billion.
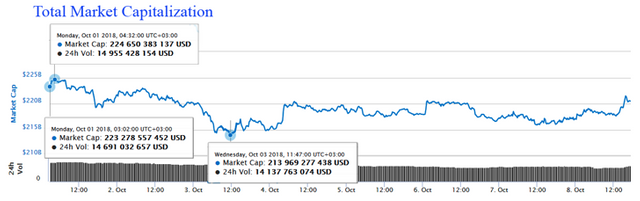
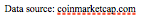
Figure 1a. Cryptocurrency market capitalization since October 1, 2018
Figure 1b shows bitcoin capitalization (red line) superimposed on cryptocurrency market capitalization (blue line). The high correlation between the indicators is obvious. This synchronicity has been seen since at least the start of the year, but at the same time bitcoin dominance has grown from 38.6% to 51.3%. The increase in bitcoin dominance is most noticeable since the start of May.
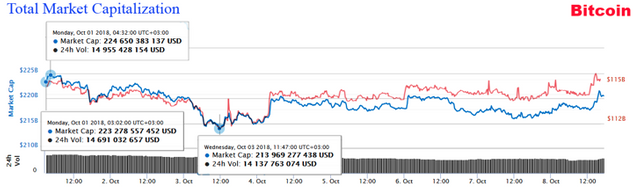
Figure 1b. Capitalization of the cryptocurrency market (blue) and bitcoin (red) since October 1, 2018
The volatility of bitcoin has fallen markedly over the past month, equaling around $200 over the past week, i.e. its price changed from $6,454 to $6,653 (Fig. 1c)
Figure 1c. Bitcoin price since October 1, 2018
On October 3 an updated version of Bitcoin Core 0.17.0 of the most popular bitcoin client was presented on GitHub and contains a number of new functions (the formulae for calculating transaction fees have been improved, the ability to create special “view only” wallets has appeared, the framework for partially signed bitcoin transactions (PSBT) has been established, etc.), transaction speed has been increased, and bugs have been fixed. In particular, pursuant to information from CoinDesk it was discovered on October 2 that the recently eliminated bug CVE-2018-1744 had previously been used to issue 235 million Pigeoncoins (PGN), which amounts to $15,000.
The rise and fall of cryptocurrency prices over the past seven days (October 1-7, 2018)
Last week’s leaders from among the top 500 cryptocurrencies by capitalization that showed the growth of more than 100% were the projects Swarm (+219.57%), Digitex Futures (+137.51%), and ARBITRAGE (+108.25%). The growth of MobileGo (+81%), IHT Real Estate Protocol (+74.82%), DAPS Token (+72.75%), DATx (+72%), MediBloc [ERC20] (+63.3%), Noah Coin (+60.65%), and TomoChain (+59.75%) should also be noted.
During the period from October 1-7, 2018, the change in the prices of cryptocurrencies in the top 500 ranged from -84% (Ubex) to +2,137.86% (Rupee). The Rupee price increased by more than 2,100% over the week, but this growth cannot be called anything other than speculative. This cryptocurrency has practically no trading volume, so any purchase on the exchange, even for $200, can lead to a sharp increase in the price. Ubex, on the other hand, showed the worst results over the week, with its price falling by 84%. The Ubex ICO, which collected its hard cap of 28,800 ETH, was completed on September 30. The price of one UBEX token during the token sale was 0.00001 ETH (without taking into account bonuses, which reached 20%). The token price jumped approximately tenfold immediately after the completion of the ICO, and then fell back to its starting price of 0.00001 ETH over the course of three days, and then tumbled lower to 0.0000087 ETH. The fall took place against the backdrop of decreasing 24-hour trading volumes from $2.7 million to $0.6 million over the week.
The price of 245 cryptocurrencies and digital assets from the top 500 showed growth, including 41 from the top 100.
Over the past week the number of cryptocurrencies with a capitalization of more than $1 billion remained the same at 16, but the price of all of them fell except for TRON (+9.11%), Binance Coin (+4.98%), IOTA (+0.03%), and Tether (the price of which is tied to the US dollar).
The coins and tokens from the top 100 that demonstrated the largest price growth are given in Fig. 2.
Biggest gainers and losers over the week (October 1-7, 2018)
The prices of some cryptocurrencies may fluctuate from -50% to +50% over the course of a single day. Therefore, when analyzing cryptocurrency price trends, it is advisable to use their average daily amounts on various cryptoexchanges.
Below we consider the 10 cryptocurrencies that demonstrated the most significant change in price over the past week (Fig. 2-3). In this regard, only those coins and tokens included in the top 100 (Fig. 2, Fig. 3) by market capitalization were considered2.
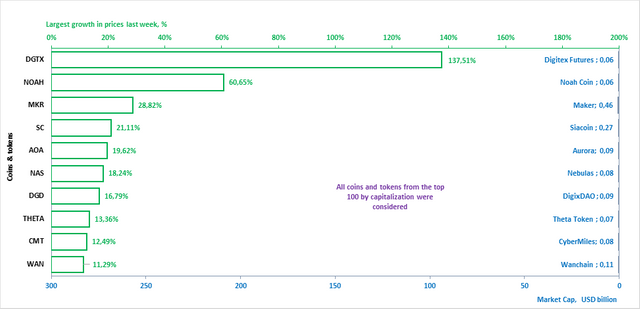

Figure 2. Largest growth in prices over the past week
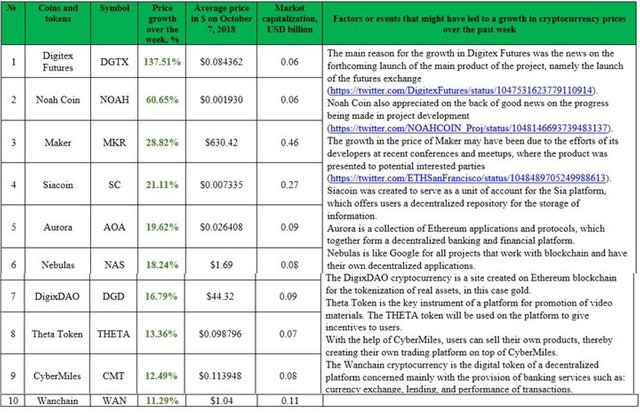
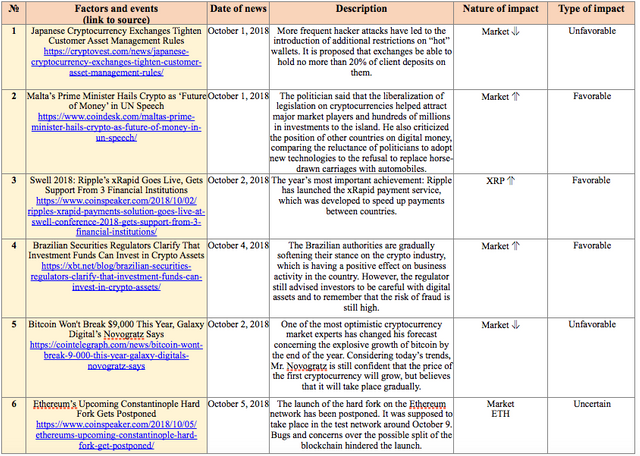
Tables 1.2 and 1.3 show the possible factors or events that might have influenced the fluctuation in prices for certain cryptocurrencies. Table 1.4 shows the possible factors or events that might have influenced the cryptocurrency market in general.
Table 1.2. Factors or events that might have led to a growth in cryptocurrency prices over the past week
A depreciation in price was seen last week for 255 coins and tokens from the top 500 cryptocurrencies and digital assets by capitalization. The ten crypto assets from the top 100 that experienced the most noticeable drops in price are shown in Fig. 3 and Table 1.3.
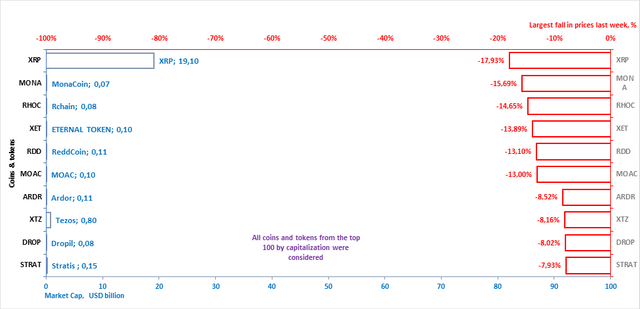
Figure 3. Largest fall in prices over the past week
Table 1.3. Factors or events that might have led to a fall in cryptocurrency prices over the past week
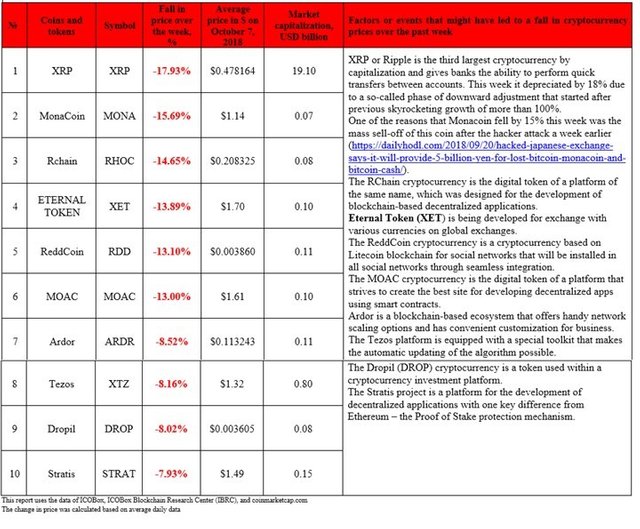
Table 1.4 shows events that took place from October 1-7, 2018, that had an impact on both the prices of the dominant cryptocurrencies and the market in general, with an indication of their nature and type of impact.
Table 1.4. Key events of the week having an influence on cryptocurrency prices, October 1-7, 2018
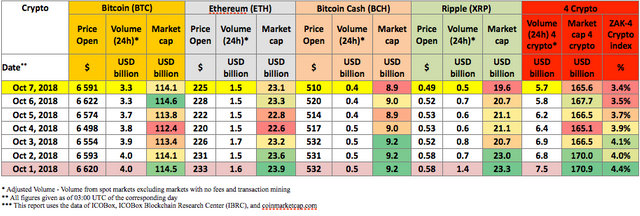
To analyze trading activity on cryptocurrency exchanges, the ZAK-n Crypto index is calculated (see the Glossary). The values of the ZAK-4 Crypto and ZAK-8 Crypto indices are presented in Tables 1.1, 1.5.a, and 1.5.b. In September the 24-hour trading volumes (Volume 24h) for the four dominant cryptocurrencies (Bitcoin, Ethereum, Bitcoin Cash, Ripple) equaled from $5.3 billion to $14.1 billion, and in early October from $5.7-$7.5 billion (Table 1.5.a). At the start of October the value of the daily ZAK-4 Crypto ranged from 3.4% to 4.4% of capitalization. The highest trading volume was seen on October 1. The main reason for this activity was Ripple, the 24-hour trading volume of which has shown sharp fluctuations over the past three weeks ranging from $0.2 to $4.1 billion.
Table 1.5.a. Daily ZAK-4 Crypto index calculation (from October 1-7, 2018)
By the end of last week the 24-hour trading volumes (Volume 24h) for the eight dominant cryptocurrencies not including Tether (Bitcoin, Ethereum, Bitcoin Cash, Ripple, Litecoin, Stellar, EOS, and Cardano) equaled $6.7 billion (Table 1.5.b), or 3.7% of their market capitalization. The ZAK-4 Crypto and ZAK-8 Crypto indices are considered in more detail in Tables 1.5.a and 1.5.b.
Table 1.5.b. Daily ZAK-8 Crypto index calculation (continuation of Table 1.5.а)
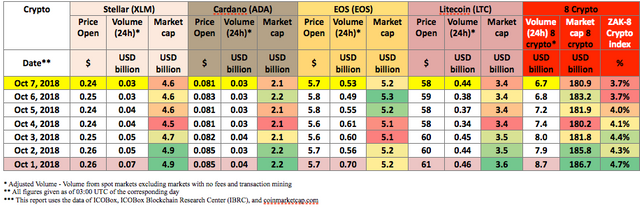
Table 1.6 gives a list of events, information on which appeared last week, which could impact both the prices of specific cryptocurrencies and the market in general.
Table 1.6. Events that could have an influence on cryptocurrency prices in the future
1.2. Market trends
The weekly cryptocurrency and digital asset market trends from December 31, 2017, to October 7, 2018, are presented as graphs (Fig. 1.1-1.5).
Table 1.7. Legends and descriptions of the graphs
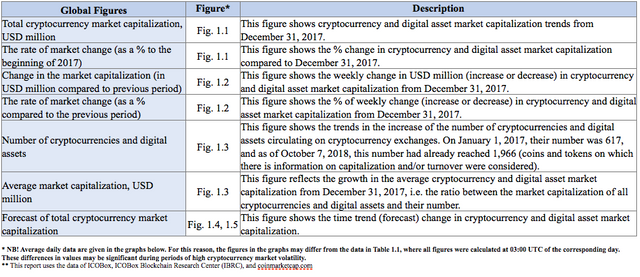
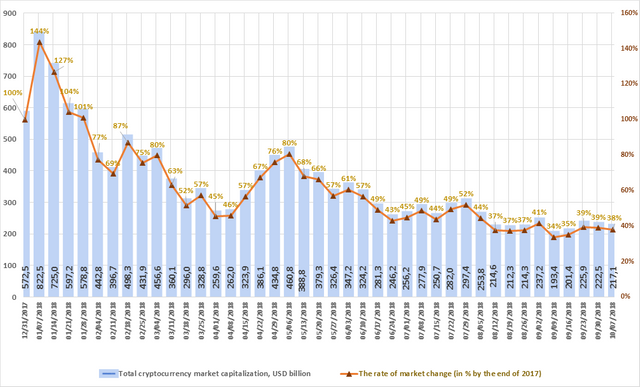

Figure 1.1. Weekly cryptocurrency market capitalization
Figure 1.1 shows a graph of the weekly cryptocurrency market change from December 31, 2017, to October 7, 2018. Over this period, market capitalization dropped from $572.5 billion to $217.1 billion, i.e. by 62%. Last week (September 30-October 7, 2018) cryptocurrency market capitalization decreased from $225.9 billion to $217.1 billion (as of October 7, 2018, based on the average daily figures from coinmarketcap.com).
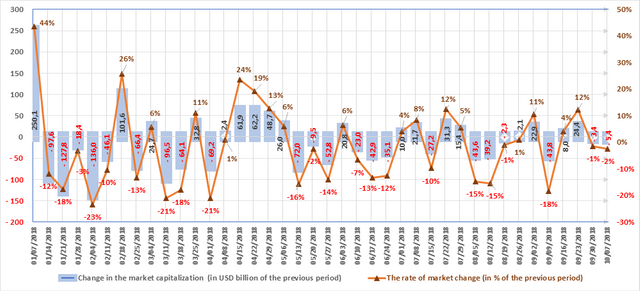
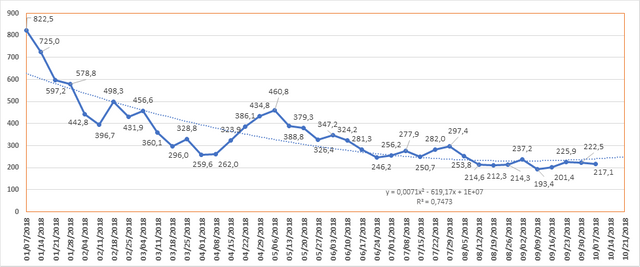
Figure 1.2. Weekly change in market capitalization
The market is subject to constant fluctuations. Nine of the thirteen weeks in the first quarter of 2018 were “in the red,” i.e. capitalization fell based on the results of each of these weeks, and the weekly fluctuations ranged from USD -136 billion to USD +250 billion.
Six of the thirteen weeks in the second quarter were “in the red.” The market grew based on the results of the other seven weeks. As noted earlier, a growth was seen in April, while in May and June there was generally a reduction in capitalization. The weekly fluctuations ranged from USD -72 billion to USD +62.2 billion.
In the third quarter seven of the 13 weeks saw an increase in capitalization, and six a decrease (with due account of average daily data of coinmarketcap.com, see Fig. 1.2). In July there was an increase of $20 billion, August saw a decrease of $49 billion, and in September capitalization fell by approximately $5 billion.
In the first week of the fourth quarter capitalization dropped by $5.4 billion, or by 2%.
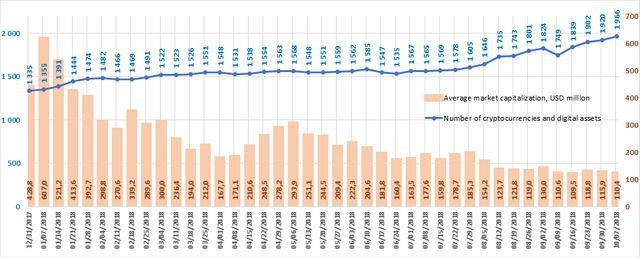

Figure 1.3. Number of cryptocurrencies and digital assets
Since December 31, 2017, the total number of cryptocurrencies and digital assets presented on coinmarketcap has increased from 1,335 to 2,042. However, when calculating cryptocurrency market capitalization only those coins and tokens on which there is information on trades (trading volume) are taken into consideration. Over the past week their number increased from 1,920 to 1,966, while average capitalization dropped to $110.4 million. In total, over the past month 133 new coins and tokens have appeared on coinmarketcap.com. However, it should be noted that a number of other coins and tokens were also excluded from the list. Among the tokens that were added to coinmarketcap.com last week, Nerves, WIZBL, Tolar and MIR COIN showed high trading volumes.
Figures 1.4 and 1.5. Forecast of total cryptocurrency market capitalization
One gets the impression that the cryptocurrency market has gone quiet in expectation of big events to come. The daily volatility of the leader of the cryptocurrency market (bitcoin) did not exceed ±4% over the month, and on average equaled ±1-2%. The news also does not have as big an impact on its price as it did earlier.
Based on the results of its research, the company Chainalysis has provided a comparison of bitcoins depending on the level of their turnover (liquidity) and types of owners. The following groups of coins were singled out: speculative coins, investment coins, service transactional coins, likely lost investment coins, and lost and unmined coins.
The traditional classification of the money supply into monetary aggregates (M0, M1, M2, M3 - where M0 are the most liquid and M3 are the least liquid categories) were used to determine the liquidity of the coins. The most liquid group included speculative coins (M0), which, according to Chainalysis, make up 23% of aggregate coins issued (4.8 million bitcoins). Investment coins turned out to be less liquid and fell into the M2 group (6.4 million, or 30% of aggregate coins issued). Likely lost investment coins and lost and unmined coins account for 6.1 million coins, or 29% of total coins issued. It should be noted that the share of speculative coins (M0) has more than doubled since the start of 2017.
At the same time, as reported by the Wall Street Journal, according to a number of experts the decentralized and insufficiently regulated cryptocurrency market is under the sway of trading bots that have a material impact on price formation. The asymmetrical nature of information, the division of spheres of influence, and the pressure from institutional and state structures is leading to a situation in which price manipulation schemes and fraud are being used on the “fledgling” cryptocurrency market. Methods of manipulation of information (spreading of rumors, misleading information, or misinformation), collusion during the performance of trading, overstating of trading volume through fictitious transactions, and the formation of various pump & dump schemes are leading to the possibility to redistribute income in favor of major players. Various methods are used to combat players who do not play fair; for example, back in February the Commodity Futures Trading Commission (CFTC) announced a reward for help in uncovering Pump & Dump schemes.
ICO Market Analysis (October 1-7, 2018)
General analysis of the ICO market (by week, month)
1.1. Brief overview of ICO market trends
General analysis of the ICO market (by week, month)
1.1. Brief overview of ICO market trends
Table 1.1. Brief ICO market overview, key events, news for the past week (October 1-7, 2018)
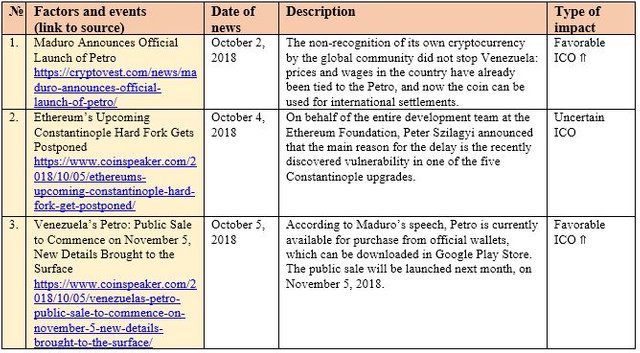
Table 1.2 shows the development trends on the ICO market since the start of May 2018. Only popular and/or successfully completed ICOs (i.e. ICOs which managed to collect the minimum declared amount of funds) and/or ICOs listed on exchanges were considered.
Table 1.2. Aggregated trends and performance indicators of past (completed) ICOs1,2,3
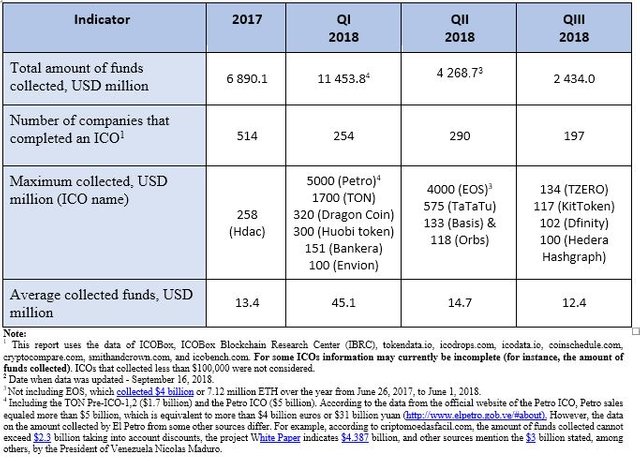
The data for the previous period have been adjusted to account for the appearance of more complete information on past ICOs. Over the previous period (October 1-7, 2018) the amount of funds collected via ICOs equaled more than $100 million. This amount consists of the results of 11 ICOs that disclosed their data, with the largest amount of funds collected equaling $29 million by the AERGO ICO. The average collected funds per ICO project equaled $9.4 million (see Tables 1.2, 1.3). A total of more than 30 ICOs were completed last week. However, not all projects indicate the amount of funds collected on their official websites (Table 1.5).
Table 1.3. Amount of funds collected and number of ICOs
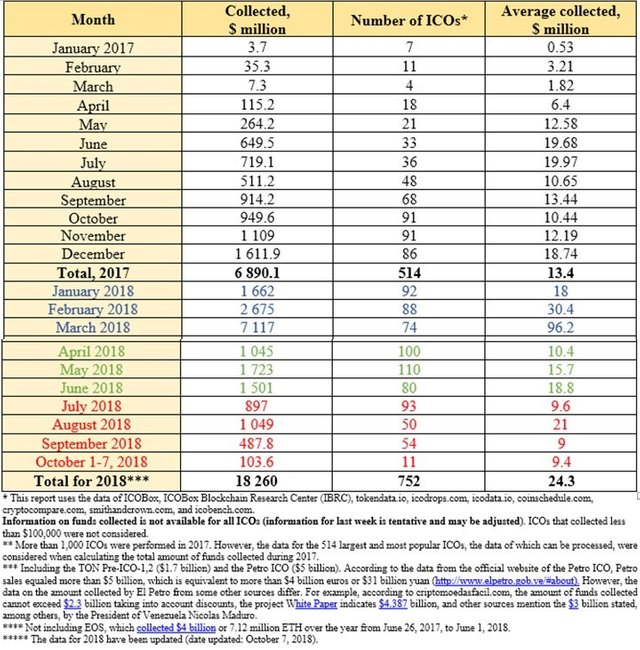
Table 1.3 shows that the largest amount of funds was collected via ICOs in March 2018, mainly due to the appearance of major ICOs. The highest average collected funds per ICO was also seen in March 2018.
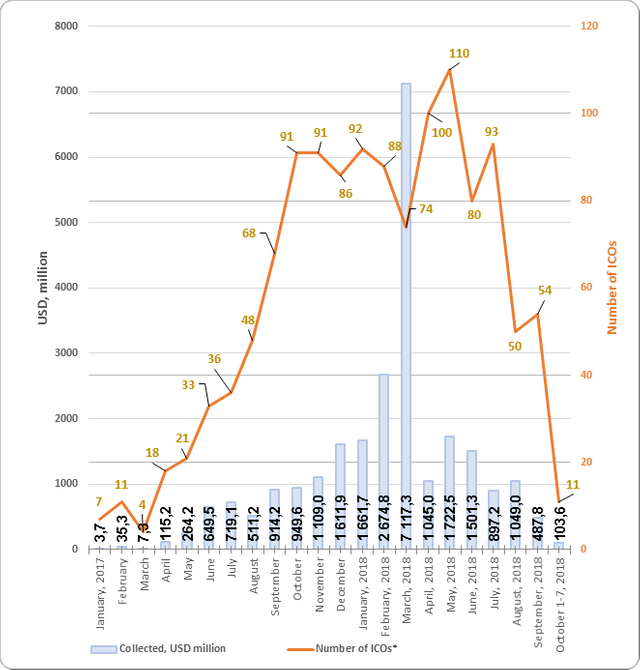
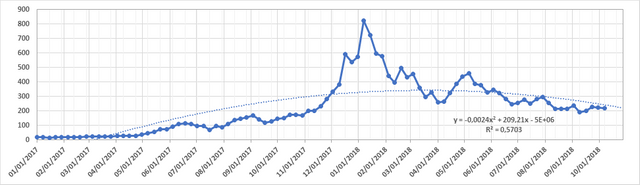
Figure 1.1. Trends in funds collected and number of ICOs since the start of 2017
1.2. Top ICOs since the start of the month
Table 1.4. Top 10 ICOs by the amount of funds collected (October 1-7, 2018)
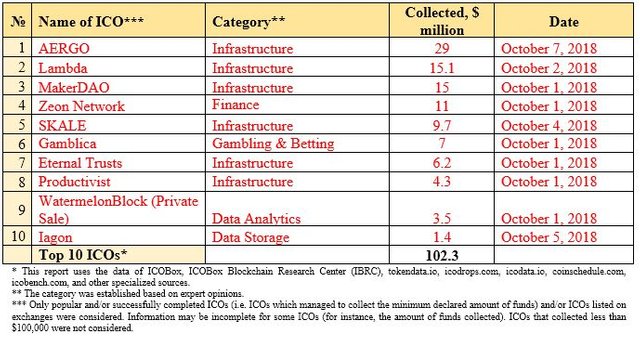
The data for the previous period (October 1-7, 2018) may be adjusted as information on the amounts of funds collected by completed ICOs is finalized.
Last week’s leader was the South Korean AERGO project, which is an all-encompassing ecosystem created to automate business processes in the corporate sector. AERGO is a blockchain with a 4th generation protocol, fast and scalable, which uses the latest in cutting-edge technology.
The AERGO architecture consists of three elements, which together form the Aergo platform: Aergo Chain (a public blockchain with a dPoS consensus mechanism and a declared throughput capacity of more than one million TPS), Aergo Hub (designed to receive access to computing capacity and for the possible launch of various apps), and Aergo Marketplace (intended for peer-to-peer trading of computing assets).
Figure 1.2 shows the top ten ICOs.
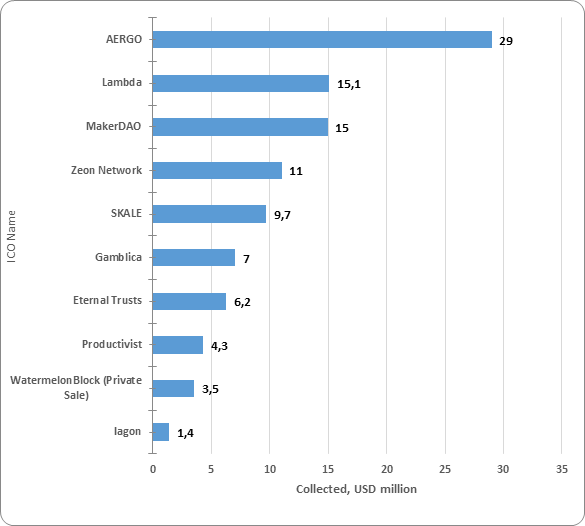
Figure 1.2. Top 10 ICOs by the amount of funds collected (October 1-7, 2018)
1.3. Top ICOs in the Infrastructure category
The list of top ICOs by category is compiled with due account of the categories of the leading ICOs for the week. Despite the fairly large amounts of funds collected, the AERGO, Lambda, and MakerDAO projects were not among the ten largest projects in the Infrastructure category by the amount of funds collected via ICO (Table 1.5).
Table 1.5. Top 10 ICOs by the amount of funds collected, Infrastructure category
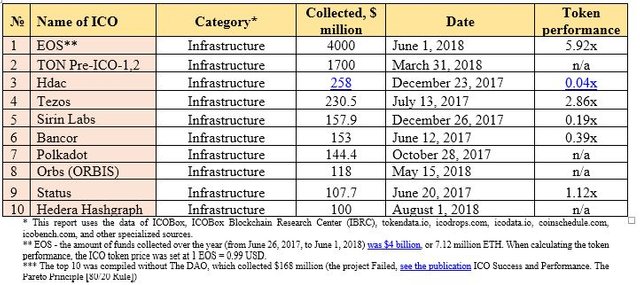
The projects from the top 10 in the Infrastructure category currently have low token performance indicators ranging from 0.04х to 5.92х. The EOS project and exchange listing can clearly be considered the most successful ICO from among the ten presented projects by the amount of funds collected, since based on estimates it collected more than $4 billion, and it has a current token price to token sale price of 5.92х. When analyzing this indicator, both the lengthy duration of the ICO (from June 26, 2017, to June 1, 2018) and the fact that the token price was constantly changing during the ICO should be kept in mind. 200,000,000 EOS tokens were sold during the first five days of the ICO, with another 2,000,000 coins subsequently being sold every 23 hours. The EOS token performance indicator given in Table 1.6 was determined based on a token sale price during the ICO of 1 EOS = 0.99 USD, and a current token price of 1 EOS = 5.86 USD. The current market capitalization of EOS exceeds $5.3 billion.
Figure 1.3. Top 10 ICOs by the amount of funds collected, Infrastructure category
During the analyzed period (October 1-7, 2018) more than 30 ICO projects were completed, and at least 11 projects have clearly indicated the amount of funds collected on their websites and this amount exceeds $100,000. The total amount of funds collected exceeded $100 million. Last week’s leader was the AERGO project, which collected $29 million. The total amount of funds collected by a number of ICOs failed to reach even $100,000 (the information for some projects is still being finalized).
The Glossary is given in the Annex.
Annex
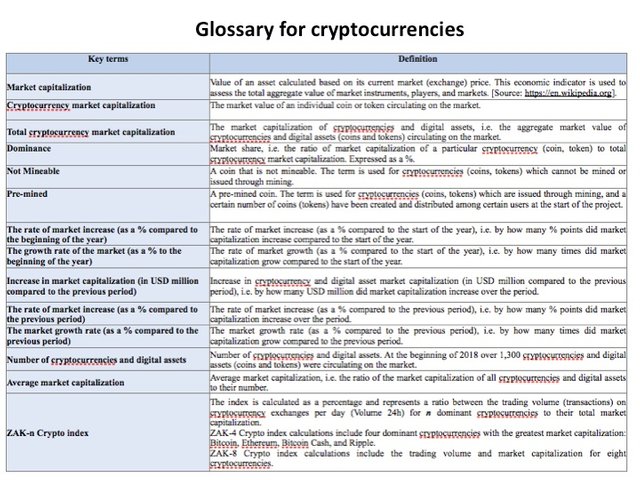
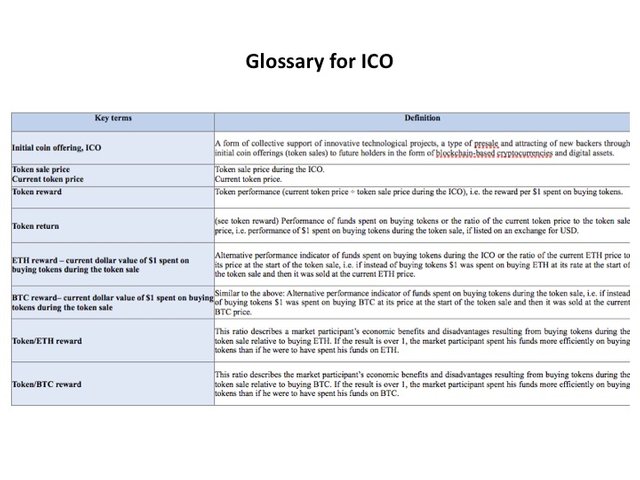
Glossary