Quarterly Cryptocurrency and ICO Market Analysis (Q1 2018)


This report presents data on cryptocurrency and ICO market changes during 2017-2018. Special emphasis has been placed on an analysis of the changes that took place in the first quarter of 2018, including over the last week (March 26-April 1, 2018).
Information as of April 2, 2018
Professor Dmitrii Kornilov, Doctor of Economics, Member of the Russian Academy of Natural Sciences, and Leading Analyst at ICOBox
Dima Zaitsev, PhD in Economics, Head of International Public Relations and Business Analytics Department Chief at ICOBox
Nick Evdokimov , Co-Founder of ICOBox
Mike Raitsyn , Co-Founder of ICOBox
Anar Babaev , Co-Founder of ICOBox
Daria Generalova, Co-Founder of ICOBox
Quarterly Cryptocurrency Market Analysis (Q1 2018)
1. General cryptocurrency and digital assets market analysis (by week, month, quarter). Market trends.
1.1. General cryptocurrency and digital assets market analysis (by week, month).
1. General cryptocurrency and digital assets market analysis (by week, month, quarter). Market trends.
1.1. General cryptocurrency and digital assets market analysis (by week, month).
Table 1.1. Trends in capitalization of the cryptocurrency market and main cryptocurrencies from December 1, 2017, to April 1, 2018
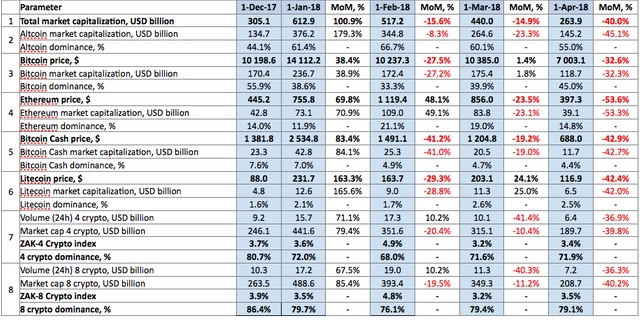

During the first quarter of 2018 cryptocurrency market capitalization was more than halved, and as of 03:00 UTC on April 1, 2018, equaled $263.9 billion (see Table 1.1, fig. 1). In January capitalization dropped by 15.6%, in February by 14.9%, and in March by 40%.
The dominance of the four and eight largest cryptocurrencies as of 03:00 UTC on April 1, 2018, equaled 71.9% and 79.1%, respectively. Bitcoin dominance increased over the quarter from 38.6% to 45% (see Table 1.1), i.e. one can conclude that in general altcoins depreciated more drastically in January-March than the leader of the cryptocurrency market.
The most significant changes in the amount of cryptocurrency market capitalization during the first quarter of 2018 are shown in fig. 1. These changes were related to numerous events (see Table 1.4).

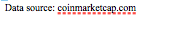
Figure 1. Cryptocurrency market capitalization since January 1, 2018
We will look at the reasons for the market decline of select cryptocurrencies on the dates:
Decline in capitalization from January 8-17, 2018
Сoinmarketcap.com excluded the trading volumes of several South Korean exchanges from its analytics, in particular Bithumb (the second largest cryptoexchange in the world), Coinone and Korbit, and also stopped taking the trading results of Upbit and Coinnest into account. As a result, the indicators of nearly all cryptocurrency and digital assets underwent changes, which sparked a wave of market exits through sales and led to a considerable reduction in total cryptocurrency market capitalization (January 8, 2018).
Information appeared in the media that the head of the Ministry of Justice of South Korea was planning to introduce a ban on trading in cryptocurrencies through exchanges (January 11, 2018). This information was subsequently refuted.
It became known through Bloomberg reports that Beijing was planning to block domestic access to Chinese and foreign cryptoexchange platforms that provide centralized trading services (January 15, 2018). News from China and South Korea always has a serious impact on cryptocurrency markets, as these countries account for a considerable share of total trading in digital currencies.
The start of Chinese New Year celebrations (in 2018 during the period from February 15-21) led to a fall in activity on exchanges.
Decline in capitalization on February 6, 2018
Synchronized movement of the Dow Jones Industrial Average (DJIA) and the bitcoin price. On February 5 the Dow Jones index fell by 4.6% over the course of one day, i.e. by more than 1,000 points, which is the largest daily drop in the US stock index in the past 10 years, after the publication of the US Department of Labor’s employment and wages statistics. Following in the footsteps of the DJIA, similar trends were seen on the S&P Index, Nasdaq Composite, Nikkei 225 and other indices, which fell from February 6-10, 2018. The price of oil also dropped.
China blocked access to all foreign cryptoexchanges (February 6, 2018)
Decline in capitalization from March 8-9, 2018
The SEC demanded that cryptoexchanges trading in tokens that meet the definition of a security under the Securities Act register with the Commission as national stock exchanges (March 7, 2018).
As a result of a hacker attack on the Binance exchange, funds were withdrawn from a number of accounts through the purchase of Viacoins (VIA), the price of which immediately increased a hundredfold. Users that relied on trade bots (API keys) were hit the hardest (March 7-8, 2018).
The trustee of the bankrupt Mt. Gox exchange published an announcement on the sale of Bitcoin and Bitcoin Cash worth $400 million and the possible sale of other digital assets worth $1.8 billion (March 8, 2018).
Decline in capitalization from March 15-18, 2018
Information appeared on March 14 stating that Google, following the lead of Facebook and Instagram, had announced its intention to ban all advertising related to the crypto industry and ICOs on its platform to protect its consumers;
On the eve of the G20 summit, scheduled for March 19-20, at which the issue of global control over the crypto industry was to be considered, capitalization initially fell, but by the evening of March 18 a growth in prices and activity began to be seen for nearly all cryptocurrencies and digital assets;
Twitter will ban advertising related to the crypto industry in two weeks (March 19, 2018). After Facebook and Google, Twitter also decided to ban all advertising related to the crypto industry. The consequences of this event, as well as pressure from other media, messengers and social networks (Snapchat, Audience Network, Instagram), resulted in a steady decline in cryptocurrency market capitalization, including over the past week. However, these events also had a boomerang effect on the share prices of these companies (for example, Twitter’s share price fell from $36 to $28).
Price change during Q1 2018 among the leaders of the cryptocurrency market
Table 1.2 shows the price change for 12 cryptocurrencies during Q1 2018. This list of coins and tokens was compiled based on the Top 10 cryptocurrencies by capitalization at the start of the year (shown in blue) and as of April 1, 2018. The prices of the Top 12 cryptocurrencies by capitalization fluctuated by more than a factor of two over the past quarter (High / Low). The NEM and Cardano cryptocurrencies endured especially large fluctuations from $2.09 to $0.20 and from $1.33 to $0.13, respectively, i.e. more than a tenfold difference between their high and low prices for the quarter. Ripple and Stellar were also subject to considerable fluctuations (see Table 1.2).
Table 1.2. Price changes in Top 12 cryptocurrencies by capitalization during the period from January 1-April 1, 2018
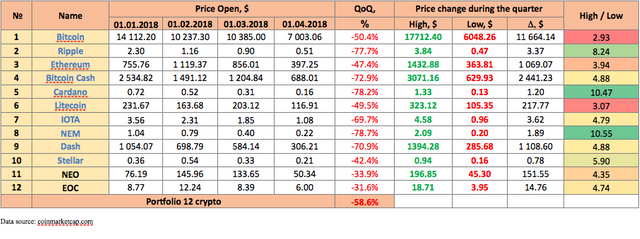
Thus, from January 1-April 1, 2018, a fall in price compared to the start of the year of -31.6% (EOC) to -78.7% (NEM) was seen among the leading cryptocurrencies by capitalization (fig. 2). The average yield of a portfolio consisting of equal shares of the cryptocurrencies in the Top 12 (Portfolio 12 crypto) for the quarter was negative and equaled -58.6%. Overall, cryptocurrency market capitalization fell in the first quarter by -54.7% compared to the start of the year.
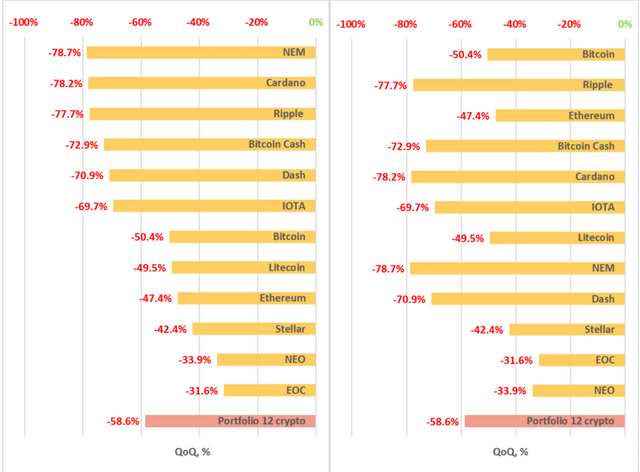

Figure 2. Price change in Top 12 cryptocurrencies by capitalization during Q1 2018, %
After the sustained growth in the cryptocurrency market throughout 2017, most cryptocurrencies and digital assets underwent a serious downward adjustment in January and early February. The price of the most popular coins and tokens depreciated significantly, to the level seen in early December. Many experts predicted this downward adjustment, as it happens after every wave of market growth. The bitcoin price trend is usually the signal for market participants, with skyrocketing growth often followed by an average 30-50% fall, leading to a downward adjustment in the price of all altcoins as well. In February total cryptocurrency market capitalization fell by another 15%, from $517 billion to $440 billion at the end of the day on February 28 (https://coinmarketcap.com/charts/). The market also showed a negative trend in March, and by the end of the first quarter of 2018 market capitalization had fallen to $260 billion, to the level at the end of November.
The bitcoin price dropped by 50% during the first quarter, which is slightly less than the drop in total market capitalization. This is due to the lower volatility of bitcoin compared to altcoins, as well as the significant reduction in transaction fees inside the bitcoin network as a result of the wider use by major players of new technologies that facilitate scalability. For example, on February 20 the cryptoexchanges Coinbase and Bitfinex announced their integration with SegWit.
Ripple was among the five coins from the Top 12 that saw a fall in capitalization of more than 70%, which might have been the result of its clearly inflated price at the end of December and in early January caused by heightened speculative demand. This quarter was also very unpleasant for Dash, the 70.9% fall in which was caused to a large degree by its delisting from the Japanese cryptoexchange Coincheck. According to media reports, the reason for the delisting was Coincheck’s extreme concern with the anonymity provided by these virtual currencies. NEM, which dropped by more than 80%, was the fastest falling coin among the Top 12. The worst news for NEM during the quarter was the theft of coins worth around $400 million from the Japanese exchange Coincheck. The price of Cardano also fell by nearly 80%. The price recovered very poorly after the market crash on February 6, and was unable to restart a favorable trend. Its trading volumes remained low compared to the start of the year, which apparently reflected a fall in the interest of market players in this coin.
The first quarter of 2018 was only slightly more successful for Litecoin than for the other coins in the Top 12. Its price fell by 50%, which is slightly better than the average market indicator. This is largely explained by the fact that Litecoin grew by more than 35% on February 14, reaching approximately $215 on February 15. This upswing during a market decline was caused by the announcement of the new payment infrastructure Litepay for Litecoin published on February 13.
The remaining coins from the Top 12 - Ethereum, IOTA, Stellar and EOS - also followed the negative market trend caused by the prolonged downward adjustment and the largely negative tone of the news items related to the strengthening of regulation of the crypto industry in leading countries.
However, NEO showed a somewhat better result against this backdrop, falling by only 31.6% over the quarter thanks to the news published on February 26 that the Weiss rating agency had assigned this cryptocurrency an A rating, which caused an immediate 15% growth in its price. You will recall that this was the first time in history that a cryptocurrency had been assigned such a high rating. The NEO price was also favorably impacted by the airdrop of Ontology tokens among NEO token holders. The free distribution of Ontology tokens (ONT) was planned after March 1 at a rate of 1 NEO : 0.2 ONT. It should be noted, however, that the ability to dispose of Ontology tokens will be partially frozen due to a temporary block placed on them.
Growth in the trading activity index on cryptoexchanges
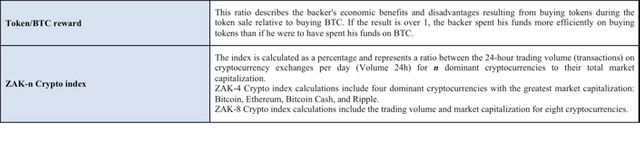
To analyze trading activity on cryptocurrency exchanges, the ZAK-n Crypto index is calculated (see the Glossary). The 24-hour trading volumes (Volume 24h) for the four and eight dominant cryptocurrencies decreased by approximately half during the first quarter (Table 1.1), which attests to a fall in activity on cryptoexchanges.
The values of the ZAK-4 Crypto indexes are shown in Tables 1.1, 1.3. In January-March the 24-hour trading volumes (Volume 24h) of the four dominant cryptocurrencies (Bitcoin, Ethereum, Bitcoin Cash, Ripple) equaled from $6 to $25 billion (Table 1.3). The daily ZAK-4 Crypto index equals 3-4% of capitalization on average, but during certain periods it has exceeded 10%. For example, on February 6, 2018, during the significant downward adjustment of the cryptocurrency market, the index increased to 10.3%, and it increased once again on March 18, on the eve of the G20 summit. This speaks to the extremely high liquidity and market dynamism of the dominant cryptocurrencies. On April 1, 2018, the 24-hour trading volumes of the four dominant cryptocurrencies equaled $6.4 billion, i.e. 3.4% of their market capitalization (Table 1.3).
Table 1.3. Daily ZAK-4 Crypto index calculation (from January 1, 2018, to April 1, 2018)
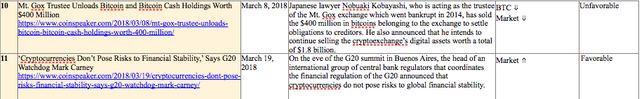
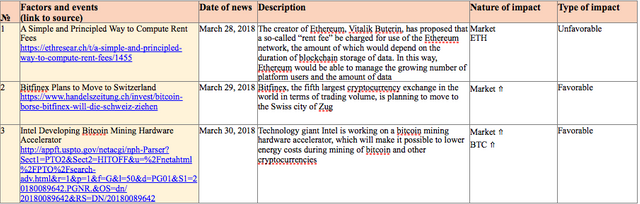
Table 1.4 shows events that took place in the beginning of 2018 and had an impact on both the prices of the dominant cryptocurrencies and the market in general, with an indication of their nature and type of impact.
Table 1.4. Key events of the week having an influence on cryptocurrency prices, January-March 2018
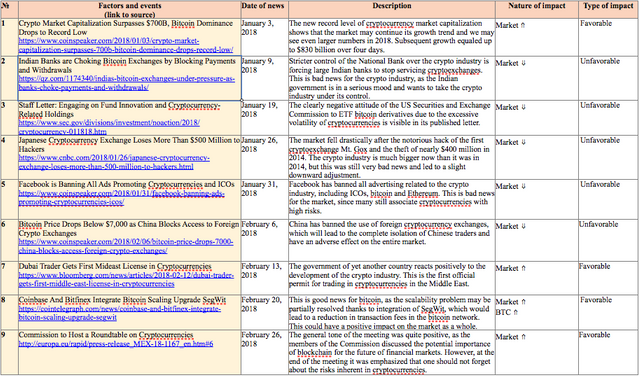
For the most part, the events of January-March were negative in nature, which led to a significant reduction in cryptocurrency market capitalization during the first quarter of 2018. However, the cost of a bitcoin transactions fell considerably. After the implementation of network scalability solutions such as SegWit and Lightning, the capabilities of the bitcoin blockchain will increase significantly. In December 2017 transaction fees had reached $55, in the beginning of 2018 they equaled $26, and on April 1, 2018, they were already less than $1 (see fig. 3). This reduction is due to the fall in the number of transactions in the network and the SegWit integration. Specifically, in February Coinbase and Bitfinex announced the SegWit integration. All these factors had a positive effect on the cost of bitcoin transactions.
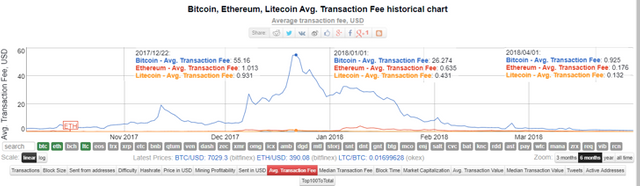
Figure 3. Bitcoin, Ethereum and Litecoin transaction fees
Table 1.5 gives a list of events, information on which appeared last week, which could impact both the prices of specific cryptocurrencies and the market in general.
Table 1.5. Events that could have an influence on cryptocurrency prices in the future
1.2. Market trends
The weekly cryptocurrency and digital asset market trends from October 1, 2017, to April 1, 2018, are presented as graphs (Fig. 1.1-1.5)*.
Table 1.6. Legends and descriptions of the graphs
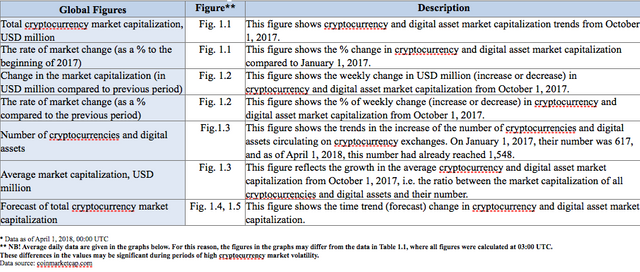
Figure 1.1. Total cryptocurrency market capitalization
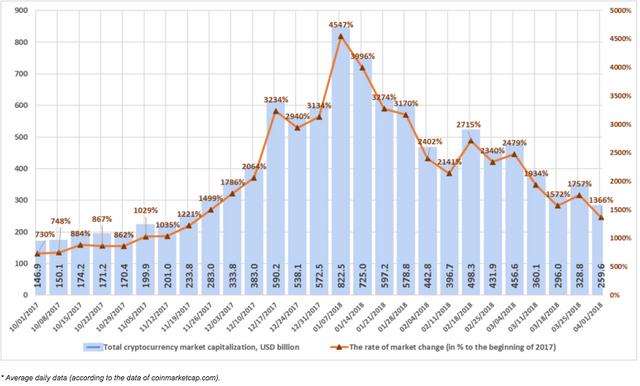
Figure 1.1 shows a graph of the weekly cryptocurrency market change from October 1, 2017, to April 1, 2018. Over this period, market capitalization increased from $146.9 billion to $259.6 billion, a growth of 1,366% compared to the start of 2017. Therefore, everyone who entered the cryptocurrency market in early 2017 was able to receive high returns due to market growth. However, the fall over the period since January 7, 2018, has equaled more than $550 billion. Last week (March 26-April 1, 2018) cryptocurrency market capitalization decreased from $328.8 billion to $259.6 billion (as of April 1, 2018, based on the average figures from coinmarketcap.com).
Figure 1.2. Change in market capitalization
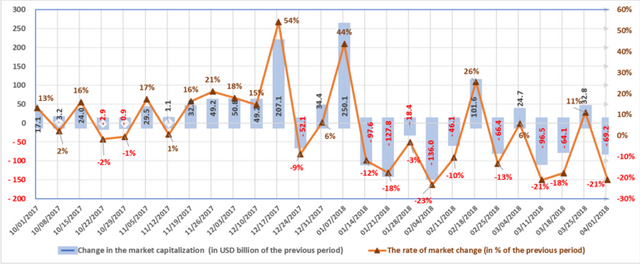
The market is susceptible to sudden and drastic fluctuations. The highest growth rate in Q4 2017 (December 17-24, 2017) was around $200 billion, or 54%. During the first week of January, market capitalization increased by approximately $250 billion, or 44%.
Nine out of the thirteen weeks in Q1 2018 have been “in the red”, i.e. capitalization fell based on the results of each of these weeks. Last week the market fell by another $69.2 billion, or 21% (with due account of average daily data, see fig. 1.2).
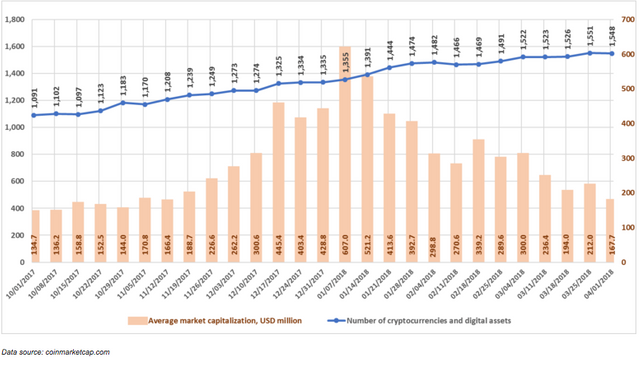
Figure 1.3. Number of cryptocurrencies and digital assets
Since the beginning of October 2017, the total number of cryptocurrencies and digital assets considered when calculating market capitalization has increased from 1,091 to 1,548. Based on the data of coinmarketcap.com, their number decreased by 3 from 1,551 to 1,548 over the last week, and average capitalization decreased to $167.7 million. Over the past month, 60 new coins and tokens have appeared on coinmarketcap.com, but it should be noted that a number of other coins and tokens were also excluded from the list.
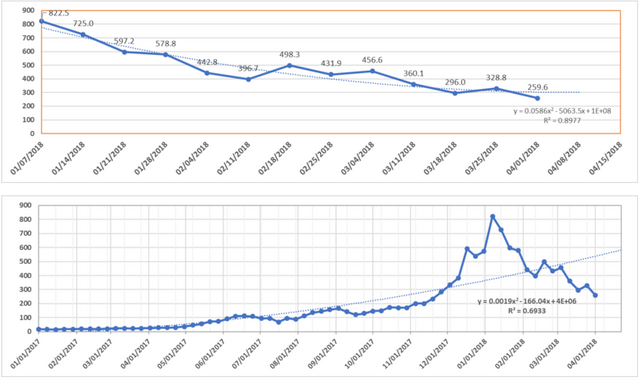
Figures 1.4 and 1.5. Forecast of total cryptocurrency market capitalization
In general, the first quarter of 2018 can be considered a trying time for the cryptocurrency market. Beginning with the second week of January, the market has been experiencing dramatic drops with gradual partial recovery. Most news events related to the cryptocurrency market have had a negative tone, and have led to a more than threefold fall in capitalization compared to the maximum level on January 7, 2018, i.e. from $830 billion to $240 billion. The hype that existed at the end of 2017 has passed. The actions of the regulators of various countries sometimes have diametrically opposed impact (from a ban to full legalization). In China and South Korea, the intentions and decisions taken for the different areas of regulation (exchanges, ICOs, mining, trading) range from permission to a ban. The only thing that does not cause doubt and apprehension is blockchain, which is recognized by nearly all institutions and countries as an area that needs to be developed.
Despite the across-the-board fall in the market and the appearance of numerous new coins and tokens during the first quarter of 2018, bitcoin has strengthened its position, with its dominance increasing from 38.6% to 45%.
ICO Market Analysis (Q1 2018)
1. General analysis of the ICO market (by quarter, month, week)
1. General analysis of the ICO market (by quarter, month, week)
While 2017 was repeatedly called the year of the cryptocurrency, 2018 may well qualify as the year of the ICO. The first quarter of 2018 has been extraordinarily successful from the standpoint of collection of funds. Right now, based on preliminary assessments, it can be said that more than $7.4 billion has already been collected, which is more than during all of 2017, and this despite a threefold fall in the entire cryptocurrency market over the first quarter. The total funds collected in 2017 equaled around $6.9 billion.
The growth in collected funds in 2018 took place despite the introduction of a number of changes and restrictions in this area related to regulation processes and the types of tokens being issued (for example, regulation of the issue of tokens by the US Securities and Exchange Commission (SEC) and restrictions on security tokens). Despite the ban on initial coin offerings in certain countries (China, South Korea), and the need to perform KYC (Know Your Customer) verification procedures, some ICO projects have established mandatory preregistration, limitations on the minimum and maximum amount of tokens purchased, a digital queue for the right to purchase tokens, etc.
1.1. Brief overview of ICO market trends
Table 2.1. Brief ICO market overview, key events, news for the first quarter of 2018
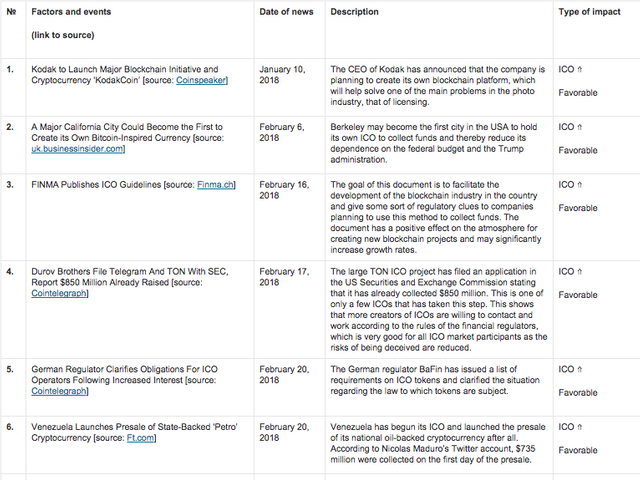
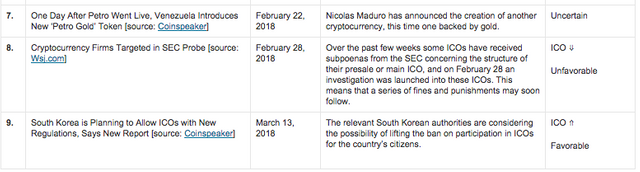
Table 1.2 shows the data for 2017 and development trends on the ICO market since the start of 2018. Only popular and/or successfully completed ICOs (i.e. ICOs which managed to collect the minimum declared amount of funds) and/or ICOs listed on exchanges were considered.
Table 1.2. Aggregated trends and performance indicators of past (completed) ICOs1,2
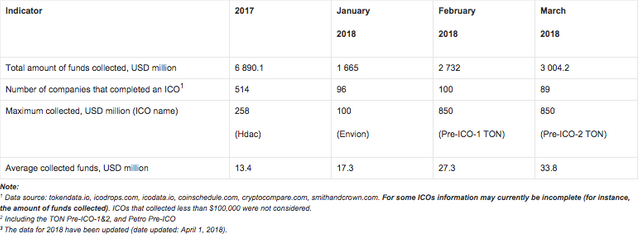
The data for the first quarter of 2018 were adjusted to account for the appearance of more complete information on past ICOs. The amount of funds collected via ICOs during the past week (March 26-April 1, 2018) equaled $1,198.4 million. This amount consists of the results of 30 successfully completed ICOs, with the largest amount of funds collected equaling $850 million (TON Pre-ICO-2) (see Table 1.4).
Table 1.3. Amount of funds collected and number of ICOs

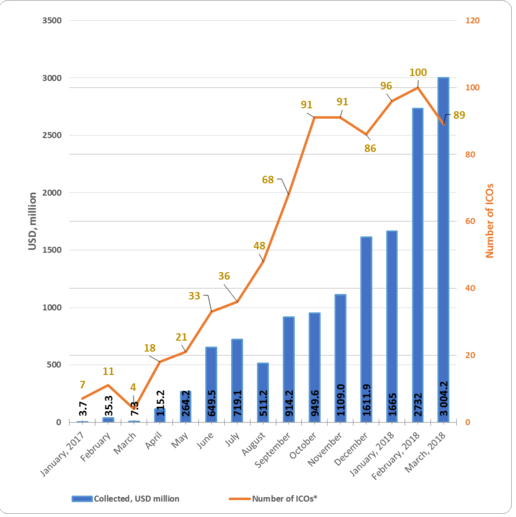
Table 1.3 shows that the largest amount of funds was collected via ICOs in February 2018. The highest average collected funds per ICO was also seen in February 2018.
Figure 1.1. Trends in funds collected and number of ICOs since the start of 2017
1.2. Top ICOs of last week
Table 1.4 shows the ten largest ICOs of the week.
Table 1.4. Top 10 ICOs in terms of the amount of funds collected (March 26-April 1, 2018)
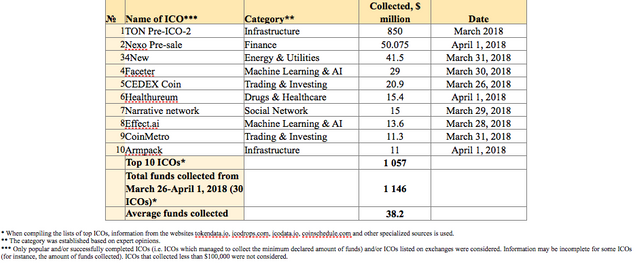
The data for last week (March 26-April 1, 2018) may be adjusted as information on the amounts of collected funds by completed ICOs is finalized.
The leader for the week was the TON Pre-ICO-2 project. In total the project has already collected $850 million twice. The TON blockchain is a scalable and flexible blockchain architecture that makes it possible to process millions of transactions per second, i.e. a sort of alternative to VISA / Mastercard for the new decentralized economy. It is assumed that the Platform (TON) will include: Data storage, Simple wallets, integration with the Telegram Messenger and much more.
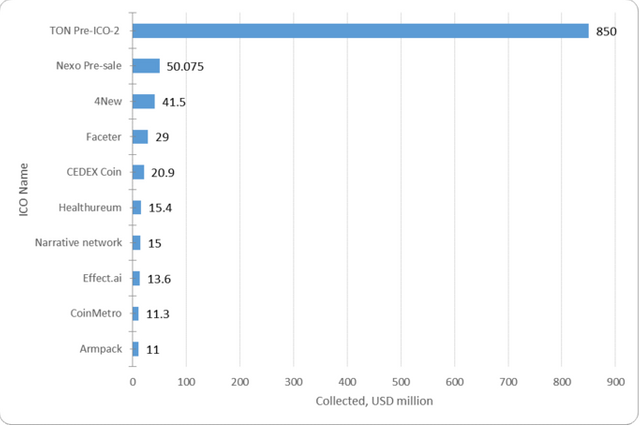
Figure 1.2 presents the ten largest ICOs completed last week.
Figure 1.2. Top 10 ICOs in terms of the amount of funds collected (March 26-April 1, 2018)
1.3. Top ICOs in Q1 2018
Table 1.5. Top 10 ICOs in terms of the amount of funds collected in Q1 2018

Table 1.5 shows the top 10 largest ICOs in terms of the amount of funds collected, most of which belong to the categories Infrastructure, Finance and Commodities.
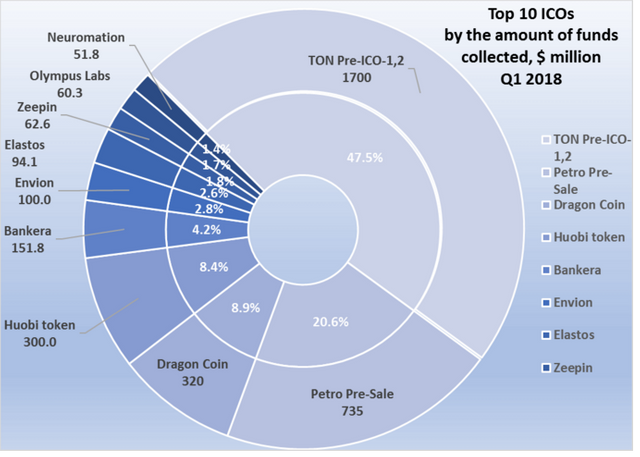
Figure 1.3. Top 10 ICOs in terms of the amount of funds collected in Q1 2018
Last week (March 26-April 1, 2018) at least 30 ICO projects were successfully completed, each of which collected more than $100,000, with the total amount of funds collected equaling around $1.15 billion.
During the first quarter of 2018 more than $7.4 billion were collected. The two largest projects of 2018 are the TON ICO and the Petro ICO, which collected record amounts during their presales and, in so doing, opened completely new possibilities for development of blockchain technology and possibilities for ICOs.
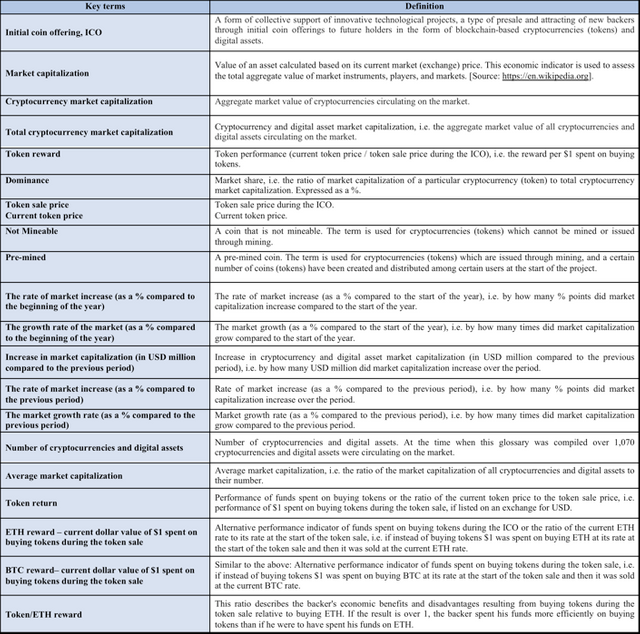
The Glossary is given in the Annex.
Annex
Glossary