Cryptocurrency and ICO Market Analysis (February 19-25, 2018)

This report presents data on the cryptocurrency and ICO market changes during 2017-2018. Special emphasis has been placed on an analysis of the changes that took place in February 2018, including over the last week (February 19-25, 2018).
Information as of February 25, 2018
Professor Dmitrii Kornilov, Doctor of Economics, Member of the Russian Academy of Natural Sciences, and Leading Analyst at ICOBox
Dima Zaitsev, PhD in Economics, Head of International Public Relations and Business Analytics Department Chief at ICOBox
Nick Evdokimov , Co-Founder of ICOBox
Mike Raitsyn , Co-Founder of ICOBox
Anar Babaev , Co-Founder of ICOBox
Daria Generalova, Co-Founder of ICOBox
Cryptocurrency Market Analysis (February 19-25, 2018)
1. General cryptocurrency and digital assets market analysis (by week, month, quarter). Market trends.
1.1. General cryptocurrency and digital assets market analysis (by week, month).
1. General cryptocurrency and digital assets market analysis (by week, month, quarter). Market trends.
1.1. General cryptocurrency and digital assets market analysis (by week, month).
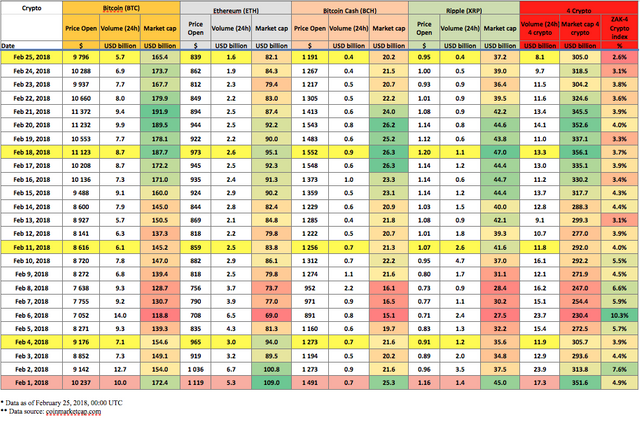
Table 1.1. Trends in capitalization of the cryptocurrency market and main cryptocurrencies from January 1, 2017, to February 25, 2018
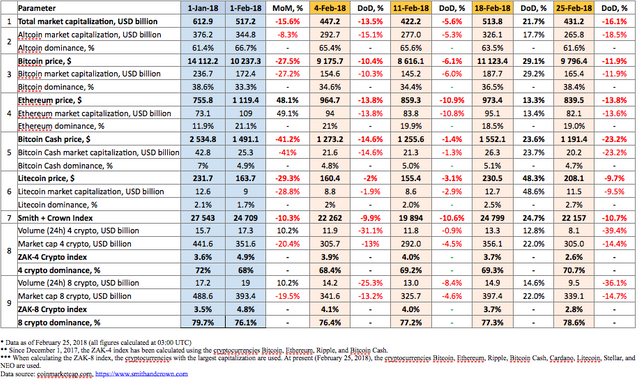
Last week (February 19-25, 2018) was marked by a 16.1% fall in capitalization of the cryptocurrency market, from $513.8 billion to $431.2 billion (at 03:00 UTC).
The Smith + Crown Index for the week decreased from 24,799 to 22,157.
The dominance of the four and eight largest cryptocurrencies as of 03:00 UTC on February 25, 2018, equaled 70.7% and 78.6%, respectively, with bitcoin dominance equaling 38.4% (see Table 1.1).
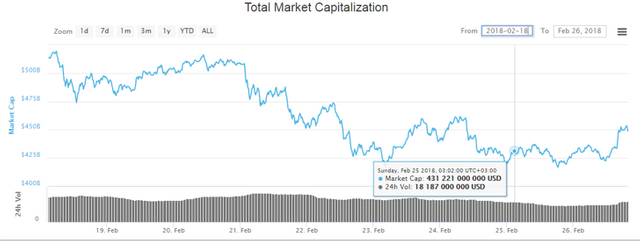
Figure 1. Cryptocurrency market capitalization, February 18-25, 2018
Overall, during the period from February 18-25, 2018, cryptocurrency market capitalization decreased by approximately $80 billion, resulting in a depreciation of the prices of 460 of the top 500 cryptocurrencies and digital assets.
Over the past week the number of cryptocurrencies with a capitalization of more than $1 billion decreased from 29 to 24, with the price of most of them falling over this period (except for Ethereum Classic and Nano), which is related to overall market trends.
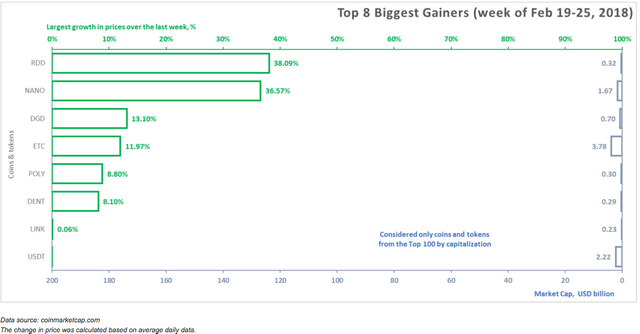
The coins and tokens from the top 100 that demonstrated the largest growth in prices are given in fig. 2.
The growth and fall of cryptocurrency prices over the past week (February 19-25, 2018)
The prices of some cryptocurrencies may fluctuate from -50% to +50% over the course of a single day. Therefore, when analyzing cryptocurrency price trends, it is advisable to use their average daily amounts on various cryptoexchanges.
Below we consider the eight cryptocurrencies that showed a growth in price over the past week (fig. 2). All other coins and tokens from the top 100 in terms of market capitalization (according to the data of coinmarketcap.com) showed a fall in price.
Figure 2. Largest growth in prices over the last week
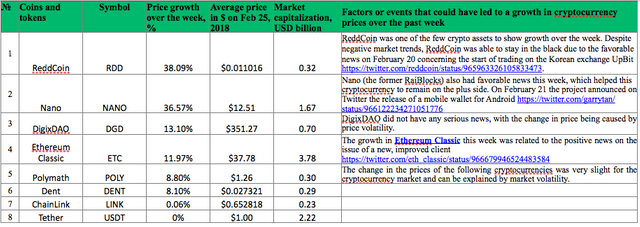
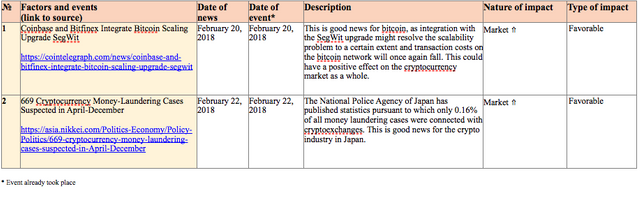
Tables 1.2 and 1.3 show the possible factors or events that could have influenced the fluctuation in prices for certain cryptocurrencies. Table 1.4 shows the possible factors or events that could have influenced the cryptocurrency market in general.
Table 1.2. Factors or events that could have led to a growth in cryptocurrency prices over the past week
A fall in price was seen for 460 of the top 500 coins and tokens by capitalization over the past week. Ninety-two of the top 100 coins and tokens by capitalization showed a drop in prices. The ten most significant drops in price among the top 100 are shown in fig. 3.
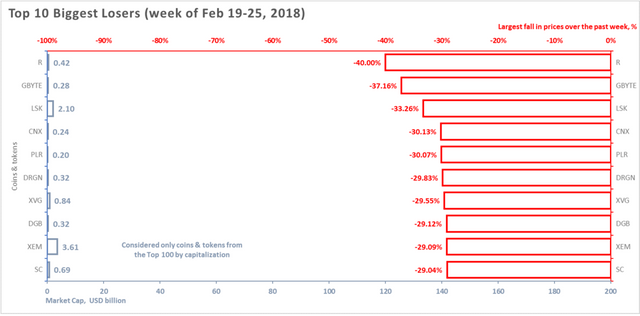
Figure 3. Largest fall in prices over the past week
Table 1.3. Factors or events that could have led to a fall in cryptocurrency prices over the past week
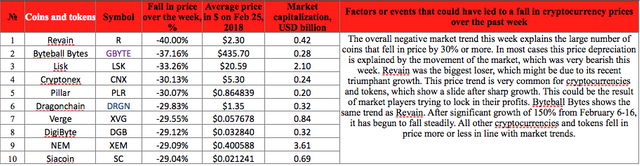
Table 1.4 shows events that took place from February 19-25, 2018, and had an impact on both the prices of the dominant cryptocurrencies and the market in general, with an indication of their nature and type of impact.
Table 1.4. Key events of the week having an influence on cryptocurrency prices, February 19-25, 2018
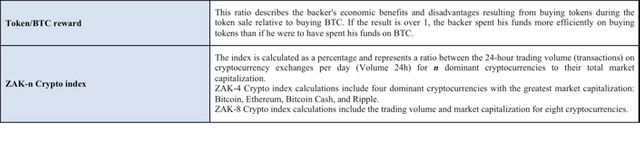
To analyze trading activity on cryptocurrency exchanges, the ZAK-n Crypto index is calculated (see the Glossary). The values of the ZAK-4 Crypto and ZAK-8 Crypto indices are presented in Tables 1.1, 1.5.a, and 1.5.b. The 24-hour trading volumes (Volume 24h) for the four dominant cryptocurrencies (Bitcoin, Ethereum, Bitcoin Cash, Ripple) last week equaled from $8.1 billion to $14.1 billion (Table 1.5.a). This is somewhat lower than at the start of the month, when the 24-hour trading volume reached $23.7 billion, and the ZAK-4 Crypto index 10.3% (February 6, 2018).
Table 1.5.a. Daily ZAK-4 Crypto index calculation (from February 1, 2018, to February 25, 2018)
The 24-hour trading volumes (Volume 24h) for the eight dominant cryptocurrencies (Bitcoin, Ethereum, Bitcoin Cash, Ripple, Litecoin, Stellar, NEO, and Cardano) fell to $9.5 billion at the end of last week (Table 1.5.b), i.e. a mere 2.8% of their market capitalization. The ZAK-4 Crypto and ZAK-8 Crypto indices are considered in more detail in Tables 1.5.a and 1.5.b.
Table 1.5.b. Daily ZAK-8 Crypto index calculation (continuation of Table 1.5.а)
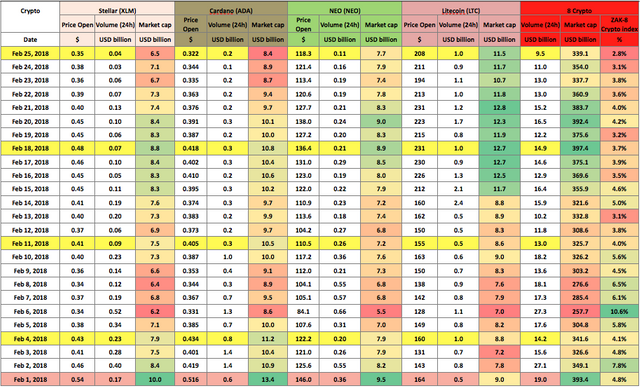
Table 1.6 gives a list of events, information on which appeared last week, which could impact both the prices of specific cryptocurrencies and the market in general.
Table 1.6. Events that could have an influence on cryptocurrency prices in the future

1.2. Market trends
The weekly cryptocurrency and digital asset market trends from October 1, 2017, to February 25, 2018, are presented as graphs (Fig. 1.1-1.5)*.
Table 1.7. Legends and descriptions of the graphs
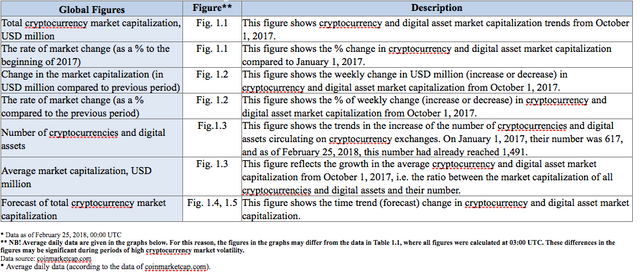
Figure 1.1. Total cryptocurrency market capitalization
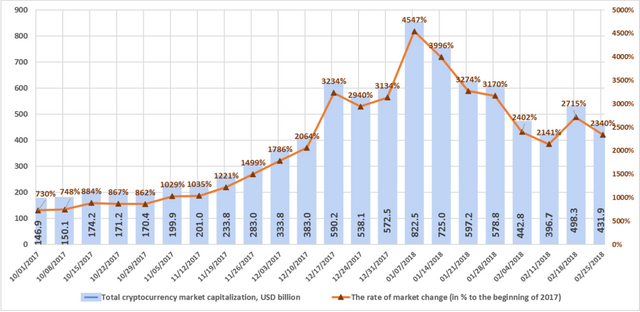
Figure 1.1 shows a graph of the weekly cryptocurrency market change from October 1, 2017, to February 25, 2018. Over this period, market capitalization increased from $146.9 billion to $431.9 billion, a growth of 2,340% relative to the start of 2017. Over the first week of January 2018, total market capitalization exceeded $800 billion for the first time, but there was a downward adjustment over the next five weeks (January 8-February 11, 2018), after which the market again began to grow (February 11-18, 2018). Over the past week (February 19-25, 2018) capitalization decreased from $498.3 billion to $431.9 billion (as of February 25, 2018, based on the average figures from coinmarketcap.com).
Figure 1.2. Change in market capitalization
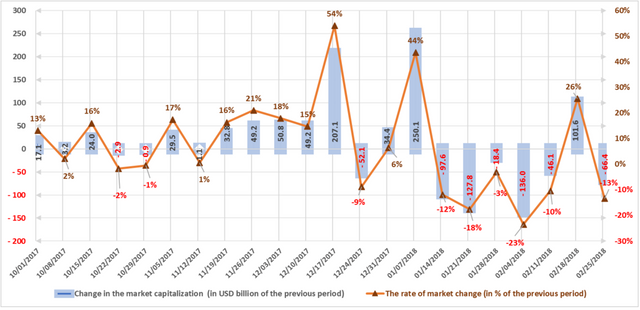
The market is susceptible to sudden and drastic fluctuations. The highest growth rate in Q4 2017 (December 17-24, 2017) was around $200 billion, or 54%. During the first week of January, market capitalization increased by approximately $250 billion, or 44%, but over the following five weeks decreases of approximately $100 billion, $130 billion, $20 billion, $136 billion, and $46 billion, respectively, were seen. Next there was a week of growth of $101.6 billion. Last week the market again fell by 13%, or by $66.4 billion (with due account of average daily data, see fig. 1.2).
Figure 1.3. Number of cryptocurrencies and digital assets
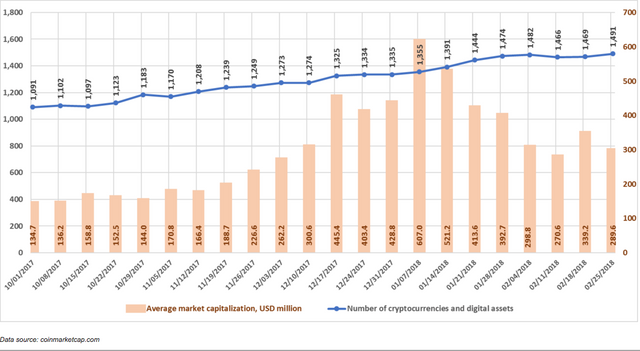
Since the beginning of October 2017, the total number of cryptocurrencies and digital assets considered when calculating market capitalization has increased from 1,091 to 1,491. Over the last week, the number of cryptocurrencies and digital assets increased by 22, from 1,469 to 1,491. That being said, their average capitalization decreased from $339.2 million to $289.6 million.
Over the past month, 69 new coins and tokens have appeared on coinmarketcap.com, but it should be noted that a number of other coins and tokens were also excluded from the list.
Figures 1.4 and 1.5. Forecast of total cryptocurrency market capitalization
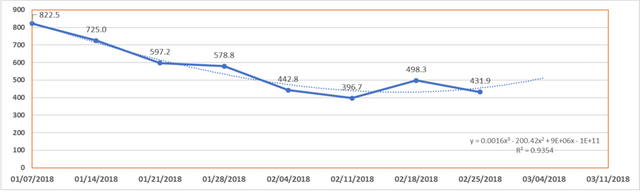
It has been apparent for several weeks in a row now that nearly all cryptocurrencies are sensitive to the overall mood of the cryptocurrency market. The correlation between the prices for most cryptocurrencies and total cryptocurrency market capitalization is obvious. However, the level of sensitivity of prices to a change in total capitalization differs. Consequently, this attribute can be used when betting on a fall or growth in capitalization.
The activity of cryptoexchanges is quite often affected by the process of regulation of the cryptocurrency market. In particular, on March 9 the Bittrex exchange will stop servicing citizens of those countries subject to US sanctions. A similar decision was taken in August 2017 by the Poloniex cryptoexchange, the purchase of which by the company Circle (founded in 2013) was announced today (February 26, 2018). Circle is becoming one of the most influential representatives of the crypto industry, with plans to create the bank of the future. The company has fairly solid investors: the investment bank Goldman Sachs, the Chinese internet giant Baidu, and venture capitalist Jim Breyer.
It is clear that institutional players are gradually entering the cryptocurrency market, which in the future will undoubtedly lead to a significant growth in capitalization. It should also be noted that the EU Committee on Economic and Monetary Affairs is holding a hearing today on the issues surrounding cryptocurrencies. All of these factors lead to a fairly optimistic outlook on the prospects for recovery and growth of the cryptocurrency market.
ICO Market Analysis (February 19-25, 2018)
1. General analysis of the ICO market (by week, month).
1.1. Brief overview of ICO market trends
1. General analysis of the ICO market (by week, month).
1.1. Brief overview of ICO market trends
The two largest ICO presales in February broke all previous records in terms of collected funds. The El Petro ICO presale, which began on February 20, collected $735 million on the first day. This was announced by Nicolas Maduro on his Twitter account. El Petro was described as a sovereign state cryptocurrency. Pavel Durov’s TON ICO presale collected $850 million. The amount of these two ICOs is already more than $1.5 billion, which speaks to the start of a new stage in the development of ICOs, to the arrival of major institutional players and backers, and to the start of the formation in countries of internal payment systems based on cryptocurrencies.
Table 1.1. Brief ICO market overview, key events, news for the week of February 19-25, 2018
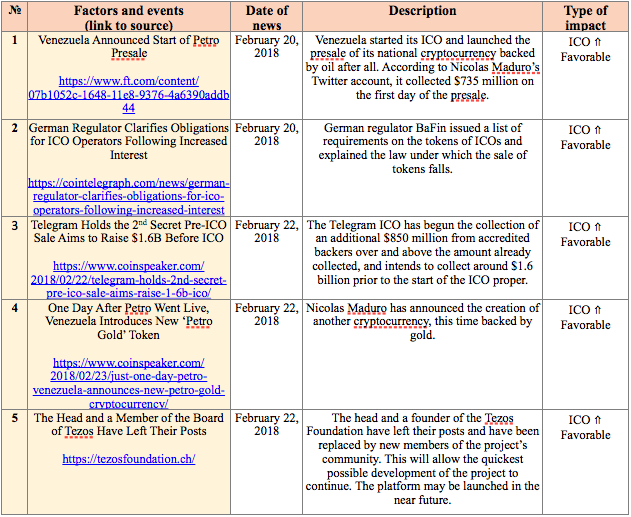
Table 1.2 shows the development trends on the ICO market since 2017. Only popular and/or successfully completed ICOs (i.e. ICOs which managed to collect the minimum declared amount of funds) and/or ICOs listed on exchanges were considered.
Table 1.2. Aggregated trends and performance indicators of past (completed) ICOs1
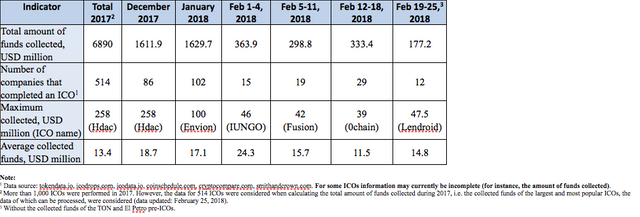
The data for 2017 and for January and February 2018 were adjusted to account for the appearance of more complete information on past ICOs. From February 19-25, 2018, the amount of funds collected via ICOs equaled $177.2 million.
This amount includes the results of the 12 successfully completed ICOs, with the largest amount collected equaling around $47.5 million (Lendroid ICO). The average collected funds per project equaled $14.8 million. More detailed information on the main ICOs, including the 12 ICOs completed over the past week, is given in Tables 1.3 and 1.4.
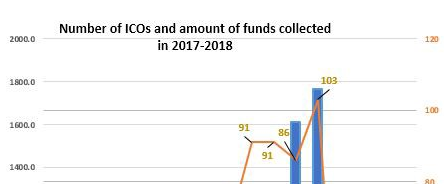
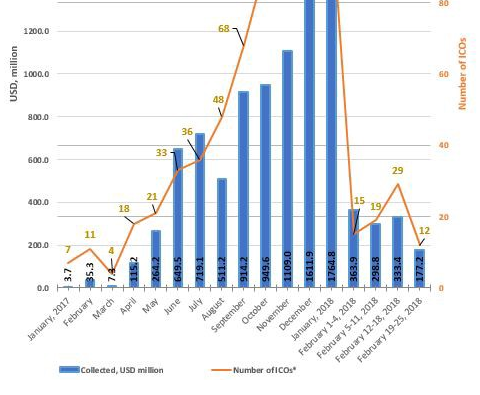
Table 1.3. Amount of funds collected and number of ICOs
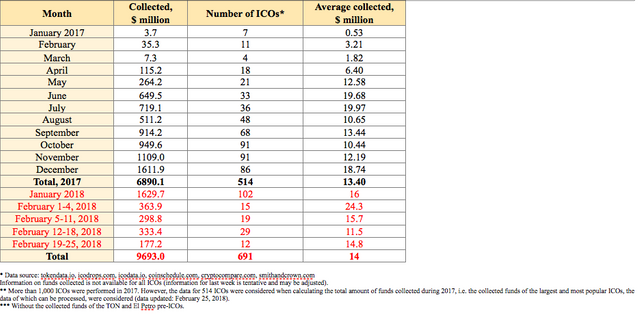
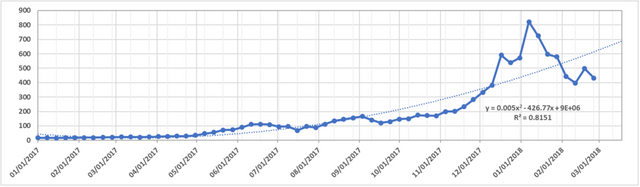
Table 1.3 shows that the largest amount of funds was collected via ICOs in December 2017 and January 2018. The highest average collected funds per ICO was seen in June, July, and December 2017.
The data for last week (February 19-25, 2018) may be adjusted as information on the amounts of funds collected by completed ICOs is finalized.
Figure 1.1. Trends in funds collected and number of ICOs since the start of 2017
1. Top ICOs
Table 1.4. Top 10 ICOS in terms of the amount of funds collected (February 19-25, 2018)
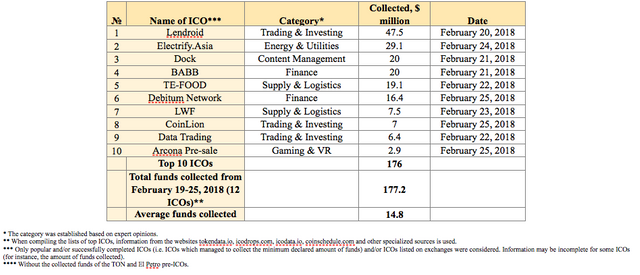
Table 1.4 shows the top 10 ICOs which were successfully completed during the period February 19-25, 2018. The leader for the week was the Lendroid project. Lendroid is a platform for margin trading and lending. According to the developers, this type of decentralized trading will make it possible to lower costs by eliminating intermediaries, and will ensure the reliability and safety of exchange trading.
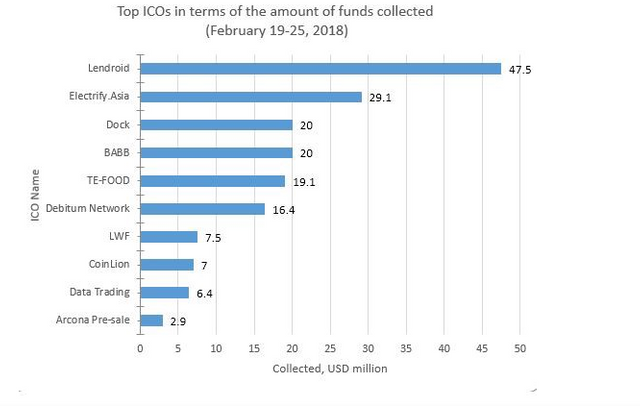
Figure 1.2 presents the ten largest ICOs completed last week.
Figure 1.2. Top 10 ICOs in terms of the amount of funds collected (February 19-25, 2018)
2. Top ICOs in their categories
The list of top ICOs by category is compiled with due account of the categories of the leading ICOs for the week.
Table 1.5. Top 10 ICOs in terms of the amount of funds collected, Trading & Investing category
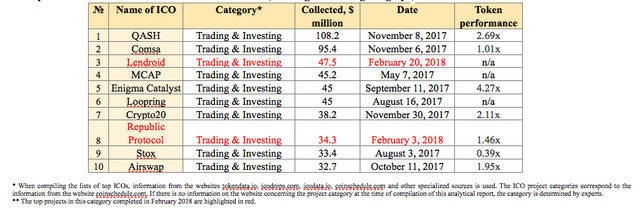
The leader of the week, the Lendroid project, was in 3rd place in the top 10 for the category.
At present, all projects from the top 10 in the Trading & Investing category have a token performance indicator of 0.39x to 4.27x. Two projects from the top 10 completed their ICOs in February 2018. The Enigma Catalyst ICO can be considered one of the most successful exchange listings, as this project has a current token price to token sale price ratio of 4.27x. When considering this indicator, it is important to remember that the Enigma Catalyst ICO was completed on September 11, 2017, i.e. the 4.27x growth took place over five months. The market capitalization of Enigma Catalyst currently exceeds $190 million.
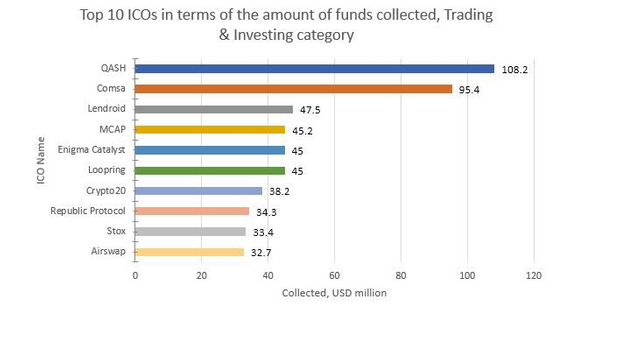
Figure 1.3. Top 10 ICOs in terms of the amount of funds collected, Trading & Investing category
In February the ICOs of five projects that can be assigned to the Content Management category were also completed.
Table 1.6. Top 10 ICOs in terms of the amount of funds collected, Content Management category
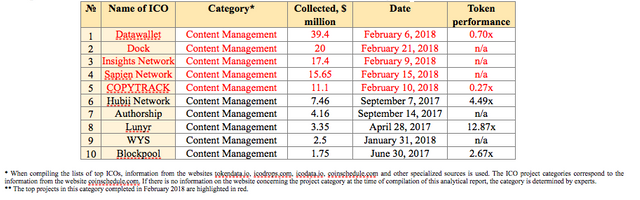
At present, the Datawallet project has the largest amount of collected funds in the Content Management category. From among the top 10 projects in the Content Management category, the Lunyr project has the best token performance indicator. Its market capitalization currently exceeds $47 million.
Figure 1.4. Top 10 ICOs in terms of the amount of funds collected, Content Management category

Five ICO projects in the Energy & Utilities category were completed in January and February.
Table 1.7. Top 9 ICOs in terms of the amount of funds collected, Energy & Utilities category
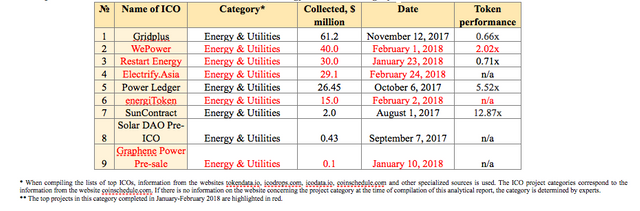
At present, the Gridplus project has the largest amount of collected funds in the Energy & Utilities category. From among the top 9 projects in the Energy & Utilities category, the SunContract ICO has the best token performance indicator. Its market capitalization currently exceeds $23 million.
Figure 1.5. Top 9 ICOs in terms of the amount of funds collected, Energy & Utilities category
Over the last week (February 19-25, 2018), at least 12 ICO projects were successfully completed, each of which collected more than $100,000, with a total amount of collected funds of around $177 million. The leader of the past week was the Lendroid project ($47.5 million). The total amount of funds collected by a number of ICOs failed to reach even the $100,000 mark (the information for some projects is still being finalized).
The Glossary is given in Annex 1.
Annex 1
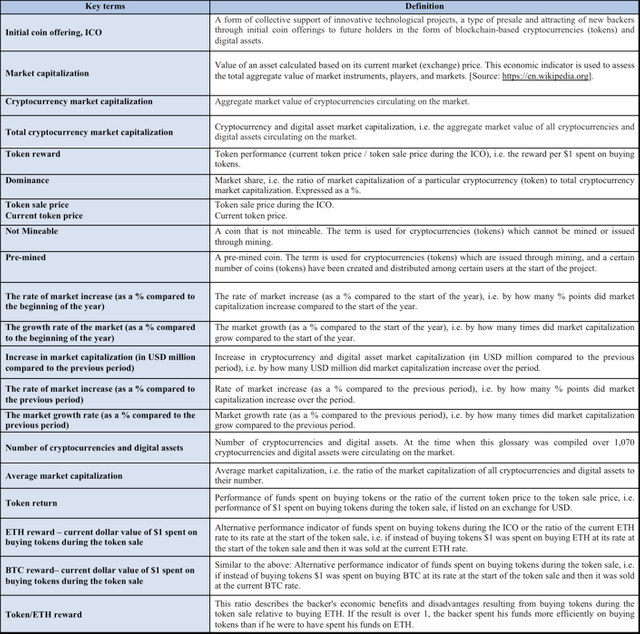
Glossary
Go here https://steemit.com/@a-a-a to get your post resteemed to over 72,000 followers.