Ethereum Analysis - Watch the 40 Day MA - SIMPLE SIMPLE
Those that have followed me know that I am very technical but also very open minded and do not let technicals rule all. Here is a simple moving average that would have saved EVERYONE a lot of heart ache.
Below is a long term price action of Ethereum. Take a second and look at the red line. It gives you the long term buys and long term sells regularly. It would have crept you out of most of this bear market and the time it got you in your would have made money.
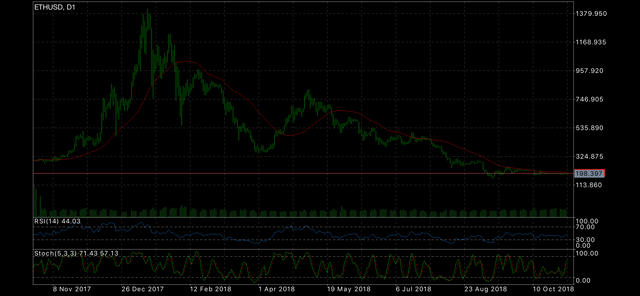
So what do we do now? Well we wait for the break. Check the zoom in....
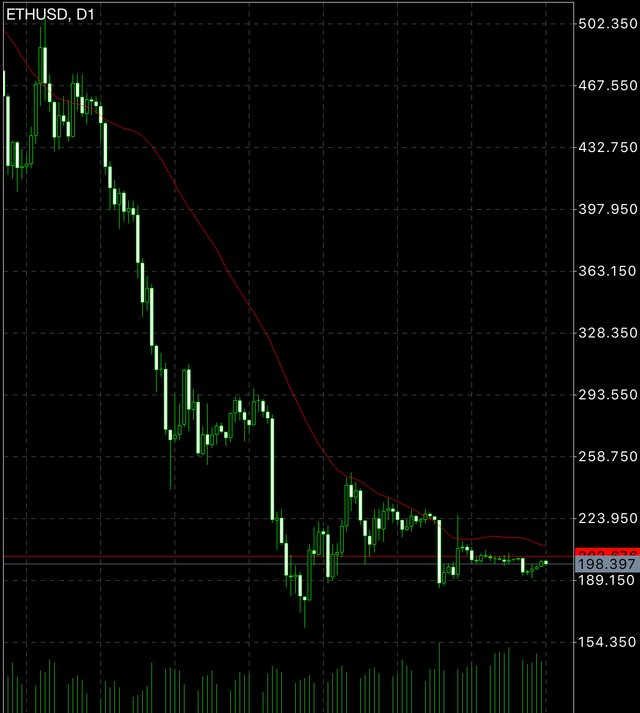
This gives you the clear entry at 209+. That is the signal for the long folks. Above it long, below it out!!
Follow me on Twitter Here

CRYPTO SNUFF

Published on

by heyimsnuffles

Fingers crossed it finds some steam. Same goes for STEEM. ;)
It did cross 209$ but it seems to lose steam now...
Captain, what do we do now !