Do ICOs push dApp growth?
Why ICOs are the best indicator of dApp growth
Published 02–04–2019; Category: Investment;dApps;ICO;Cryptocurrency

Decentralized applications (commonly known as dApps or DApps, but for the purposes of this essay, dApp shall be used) are becoming increasingly popular in the blockchain ecosystem, and the biggest application of smart-contract platforms such as Ethereum and EOS.
dApps are applications that run on peer-to-peer (P2P) computer networks, and for our purposes, applications that run on a blockchain P2P network.
Blockchain dApps are Web3-enabled websites (websites that interact with blockchains) that use a smart-contract to connect, and take information from, a blockchain, i.e., using the blockchain as a database in the backend.
dApps provide several advantages over traditional web applications, such as decentralization (no single entity can shut it down) and open source (the source code is available to the public).
Popular dApp platforms
The most popular dApp platforms are Ethereum, EOS, Steem, Tron, POA and Gochain. Ethereum, founded in 2014/15 through ICO funding, was the first major smart-contract platform made specifically for dApps and to support dApp developers.
The first major dApp on the Ethereum blockchain that caught headlines was Augur, a decentralized forecasting platform, which hosted its ICO in 2015, and recently released their dApp on the Ethereum mainnet.
Figure 1. Growth of the dApp Market
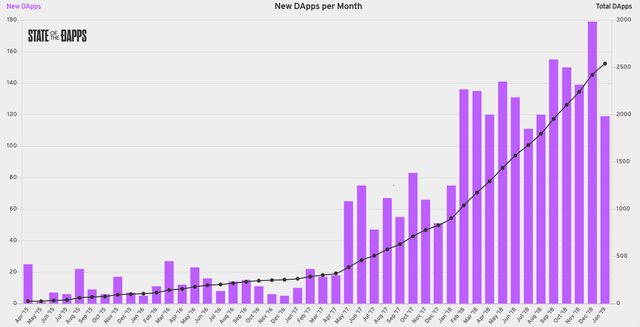
Source: StateoftheDApps; Accessed on Feb. 02, 2019
dApps have been gaining fire the past year even with the bust of the great cryptocurrency bubble in early 2018.
Thanks to the rise in ICO funding in 2017 and the emergence of TRON and EOS as new smart-contract platform competitors for Ethereum, the dApp market started to thrive and prosper.
Even when the cryptocurrency market took a substantial drop in 2018, the dApp market continued to grow with the addition of 1592 new dApps (from December 2017 to December 2018), which led to a 292% growth in the total number of dApps in the dApp market from the previous year.
However, it’s strange that the dApp market has avoided the downturn in the cryptocurrency markets, especially when the majority of ICOs were held on Ethereum.
Ethereum’s market activity took a nose dive in 2018, with a 92.65% fall from it’s all time high of $1,538.13, more than $1 billion dollars lost in volume on exchanges, and losing ~1100% of its market cap.
Figure 2. Ethereum Historical Chart
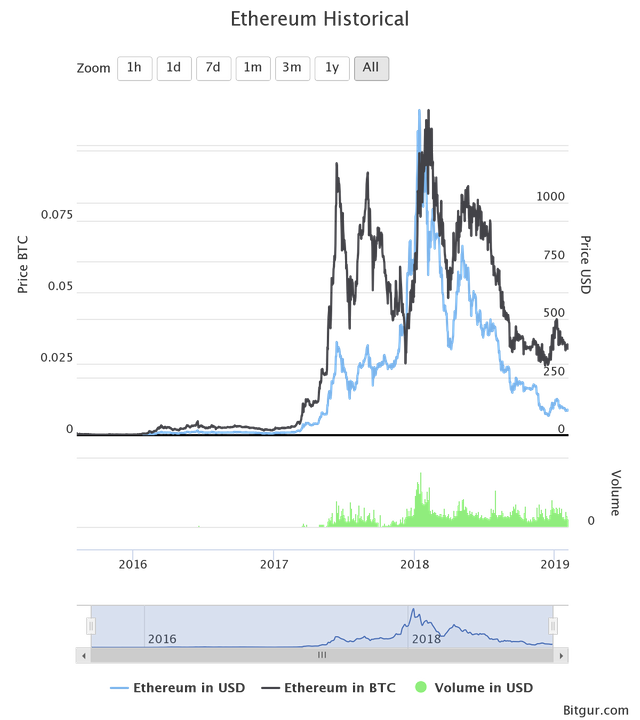
Source: Bitgur; Accessed on Feb. 02, 2019
Since the market activity does not seem to explain the dApp market growth, we turned our eyes to the ICO market because most dApps are created by projects after raising funds through an ICO.
We found that the ICO market was a much better indicator of growth in the dApp market.
Figure 3. Total Funding and Total dApps Comparison for 2017
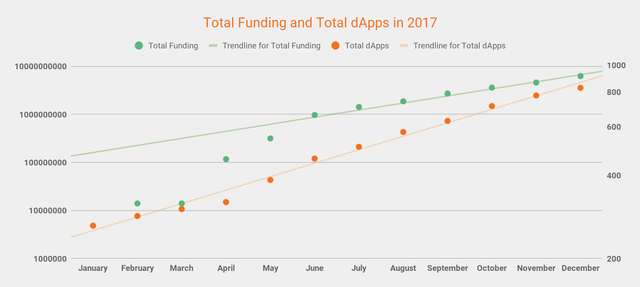
Source: StateoftheDApps, ICOdata; Accessed on Feb. 02, 2019
The correlation between total ICO funding and total dApp growth (“total-to-total correlation”), added monthly in 2017, had a had a very strong positive correlation of r= 0.9695 (accounting for an outlier or missing data in January 2017).
Figure 4. Total Funding and Total dApps Comparison for 2018
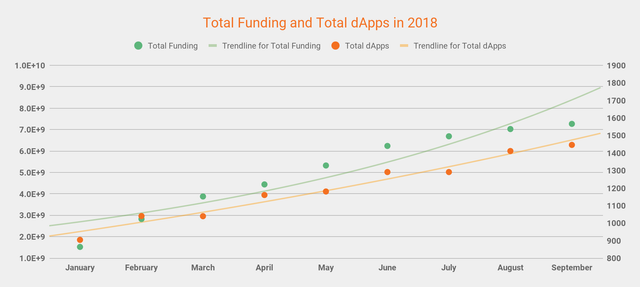
Source: StateoftheDApps, ICOdata; Accessed on Feb. 02, 2019
This pattern was also reflected in 2018, with total ICO funding and total dApp growth having a strong positive correlation of r= 0.9394.
Figure 5. Monthly Funding and New dApps Comparison for 2017
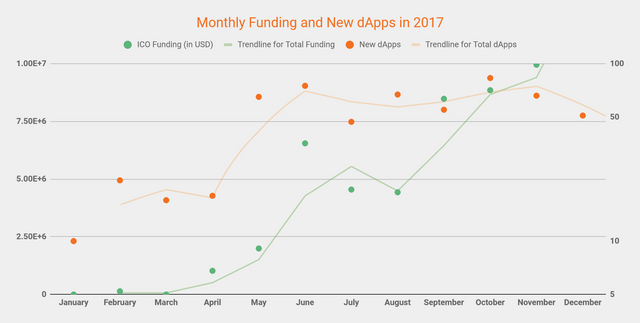
Source: StateoftheDApps, ICOdata; Accessed on Feb. 02, 2019
However, we found disparate or opposite relationships when we compared monthly ICO funding and monthly new dApps for 2017 and 2018.
The correlation for monthly ICO funding and monthly new dApps for 2017 was a moderate positive relationship, with an r = 0.6037.
Figure 6. Monthly Funding and New dApps Comparison for 2018
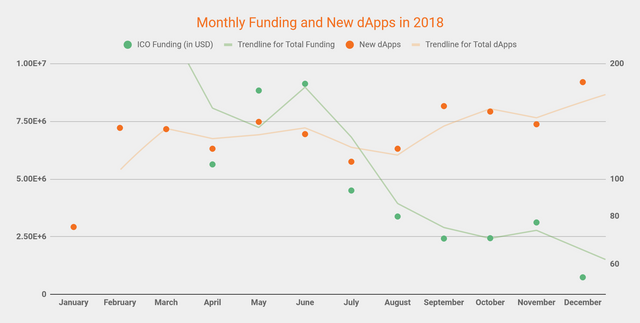
Source: StateoftheDApps, ICOdata; Accessed on Feb. 02, 2019
The correlation for monthly ICO funding and monthly new dApps (“month-to-month correlation”) for 2018 was a moderate negative relationship, with an r = -0.6195.
The complete reversal from 2017 to 2018 for monthly ICO funding and monthly dApp growth may be explained by three factors.
First, the increased regulatory pressure on ICO promoters and managers.
Second, that the most promising projects received their funding in 2017, such as Status, TRON, Kin, Tezos, VeChain, Sirin Labs, Bancor and Cardano.
Third, the majority of projects that held ICOs in 2017 failed to show sufficient progress in 2018, thus leading to less ICO funding in 2018 for fear that the project would not deliver on their ICO promises, which in turn led to fewer dApps being released onto the market.
Conclusion
Given that the month-to-month correlation is moderate, while the total month-to-month correlation is strong, we recommend following the total month-to-month growth for examining the effect of the ICO market on the dApp market.
Additionally, we expect total ICO fundraising to be a good predictor of dApp market growth for 2019.
Thank you for reading! Subscribe to Ledgerwire for even more interesting stories tailored to meet your needs.
Check out our other articles on Medium
Originally published at www.ledgerback.coop.