Litecoin Chart |Resistance
Peace Steemians,
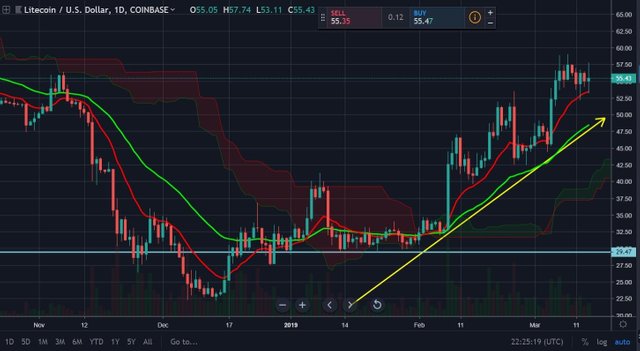
LTC is entering a testing resistance zone.
We expect in one or two days higher high on the daily candle.
However an lower low is hardly an option in this current phase on the chart.
Litecoin above 57USD is good to break the last ceiling price on LTC uptrend.
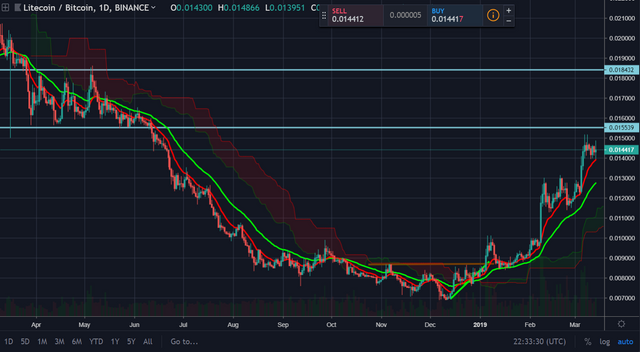
LTC above 15k Satoshi is good to confirm the continous uptrend.
The blue lines are some resistance zone that may be difficult to break.
We expect during this coming seven days the first blue line tested.
BRAVE BROWSER
FREE Presearch Coins

Thank you for stopping by here and reading the post.
This information are only my personal views and opinion.
Warm regards