#5 SMT01 For Trading In Crypto Space
Hello! Friends,
Welcome #5 SMT01, I hope many have record lesson learned so far. We shall continue in this understanding as we identify some individual with there role in crypto space. The last drop ended with an indicator on the black swan. Do you remember? If not, check out here
Pixabay: Trading Candlestick Chart
We begin today with HNWI. Who is HNWI?
- HNWI
This is an acronym from High-Net-Worth Individual and this is a someone who trades large enough amounts of an asset that the trades can move the market for that asset.
We can also define HNWI in a number of ways but the common way or method by which we identify High Net Worth Individual is by seeing whether they qualify as an accredited investor.
- Whale
This is a colloquial term for the biggest players in the crypto trading space. We can call HNWIs as a whale but also there are large institutional investors like hedge funds. Whales are using responsible for buy walls and sell walls.
- Value at Risk
Value at Risk is coined to VaR which is a statistical method of measuring a portfolio's risk. If someone is expecting a maximum amount of value to lose over a given time horizon, we say it Value at Risk. Imagine your crypto in your wallet (portfolio) has 80% 3-week VaR of $150,000, this simply means that, you have 80% confidence that the crypto in your wallet (portfolio) will not lose more than $150,000 of value over the next three weeks.
Let's go deeper.
- Put Options
In your wallet or exchange you sighted the word put options, this simply means a contract that gives its holder the actual right to sell a specific amount of a given asset within a certain period of time. It is not an obligation to take note. Your put option appreciates as the underlying asset depreciates in value, due to this when you consider the put options of buying an asset like Bitcoin its simply a method of shorting bitcoin.
- All-Time Low
The shorthand form for All-Time Low is ATL which is the lowest price that a particular asset has ever had. Remember FUD, In trading crypto, the common fear is the emotional forces which are that FUD will lead them to sell off an asset at or near its ATL. You can flash back the meaning of FUD **[Here](
- All-Time High
This is attached to FOMO. It is the highest price an asset has ever had. Here, a common fear is above FOMO which will lead one to irrationally buy an asset at or near its All-Time high.
- Bag holder
Have you experience some tokens or coins in your wallet and find out they all have no value? An informal term for someone that holds an asset that continually decreases in value even to the point of being worthless is known as Bag Holder. In the crypto space, we sometimes used this to refer to people who continue to hold an asset due to Faith alone, and at the end, the token ended up worthless.
- ROI
This is a percentage gain on an investment that is why its called Return On Investment. The efficiency measurement carried out on an investment like you bought 1Bitcoin for $4,000 and you sold it a month later $4,500 your ROI would simple be &500/$4000 equal to 12.5% in 1 month.
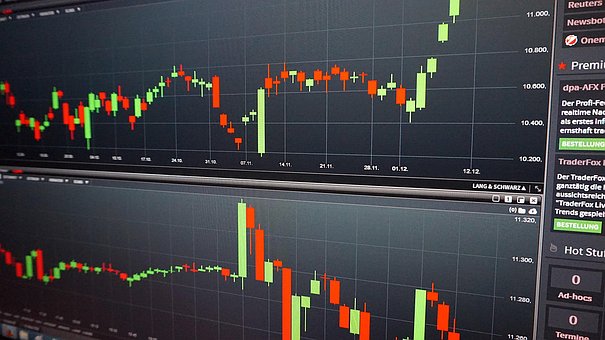
- Candlesticks
When you enter trading platform there is a graphical representation of asset history on the page. This is called Candlesticks. In most cases its use in the technical analysis due to the fact that shapes of candles are thought to be useful indicators of where an asset's price might be heading next. Due to the different instance on the trading platform as a result of timing, there are different candlestick charts on the page. One might represent 1 hour trading period why another represent 20 minutes trading periods.
Pixabay: Candlesticks
Let's do some anatomy on trading
Remember bullish and bearish we discussed early, in trading platform, the color of a candle shows whether the asset closed at a higher or lower price than its open price for the period of time that the candle represents. As far as candlestick is concerned, bullish is represented by green candle which shows that the closing of an asset is higher than the opening and when you sighted red candle its shows the bearish which is the vice versa of bullish. Looking at the bottom and the top of a candle's true body, it shows the opening and closing prices of the asset. If you take a close look at the candlestick and sighted a shadow like a line protruding from the top and bottom of its true body it is the price of an asset at maximum and minimum during the candle's period.
- Bollinger Bands
Two things can happen during trading which are, an asset can be overbought and an asset can be oversold. Bollinger bands are two standard deviations lines above and below an asset's simple moving average. An asset is considered been oversold when the trading near its lower Bollinger band and overbought when an asset is trading near its upper Bollinger band.
We shall continue....
Thanks you for following.
Hello! I find your post valuable for the wafrica community! Thanks for the great post! We encourage and support quality contents and projects from the West African region.
Do you have a suggestion, concern or want to appear as a guest author on WAfrica, join our discord server and discuss with a member of our curation team.
Don't forget to join us every Sunday by 20:30GMT for our Sunday WAFRO party on our discord channel. Thank you.
Your post has been featured on @wafrica
Courtesy of @nmalove