Irreplaceable helpers of the cryptotrade: levels, fan and Fibonacci extension
As you know, the prices of any assets can not move constantly in one direction - the trend is periodically replaced by a correction, or even unfolds in the opposite direction.
After the impulse of growth or decline, sooner or later a correctional movement is formed. It is rather difficult to predict the depth of the rollback in advance, however, there are instruments of technical analysis that allow predicting the likely scales of correction.
Fibonacci Retracements
This tool is very popular in technical analysis, used to determine the possible levels of price reversals.
The construction of such levels is based on the coefficients that are calculated on the basis of the numerical Fibonacci sequence.
Using the tool "Fibonacci Levels", you can see that intra-trend corrections often end at the levels of 23.6, 38.2, 50.0, 61.8 and 76.4 (%). However, the most popular levels are 61.8% and 38.2%. Many analysts consider them to be the most durable and reliable when used in trading strategies.
Note that the level of 50.0 is not related to the Fibonacci numbers. This value is based on one of the provisions of the Dow theory, which states that in practice, the depth of price correction is often 50% of the initial impulse.
Thus, these levels (often referred to as the "Fibo grid") serve mainly to determine the depth of correction on a bullish or bearish trend and, accordingly, to identify levels of support and resistance. Fibonacci tools are often used by traders in combination with various indicators (for example, with MACD, which was mentioned in the previous material) and figures of technical analysis.
To build the Fibonacci levels on the chart, the minimum price value is taken as the starting point with an uptrend, and the maximum value for the downward trend.
In the figure below, the appropriate levels are built using the "Fibonacci retracement tool" of the Trading View platform. As the starting point (A), the beginning of the upward trend was chosen; in the role of the final (B) - its completion.
When the line is drawn from the beginning to the end of the trend, the indicator automatically calculates the Fibonacci levels, displaying them on the chart
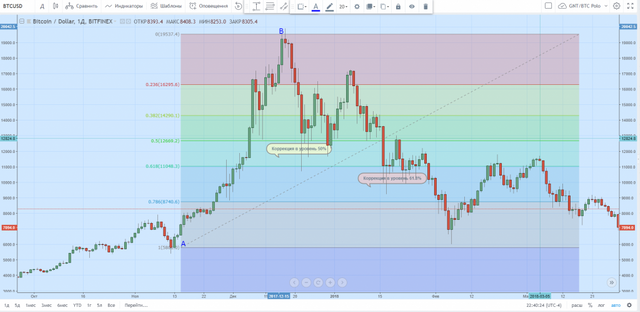
On the chart, it is noticeable how the price several times repelled from the area at the mark of 50%, which for some time served as support. Then this level in the second half of January 2018 was still broken, and the bears encountered a new obstacle in the region of 61.8% of the Fibonacci scale. The latter also after a while was broken through, becoming a level of resistance.
The study of this chart suggests that many traders probably took short-term profits, placing limit buy orders on these levels, and then fixing the profit after rebounding the price up to the next value of the "Fibo grid".
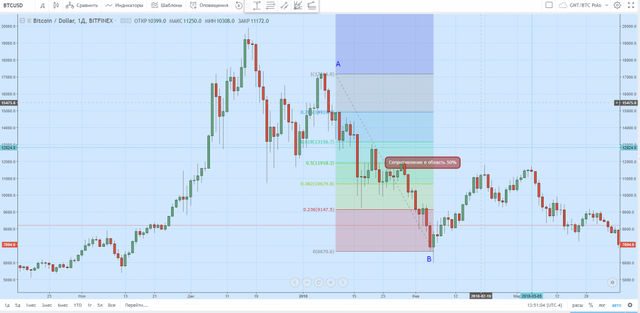
On a downtrend, Fibonacci levels are defined similarly. The only exception is the line AB is built from the maximum of the price to its minimum:
Many traders working with Fibonacci levels are convinced that:
23.6% and 76.4% are considered relatively unreliable levels;
correction in the area of 38.2% and 50% are considered more or less reliable;
the most credible are the corrections to the region of 61.8%, which is based on the so-called "golden ratio".
However, when working with this tool, the following important nuances should be considered:
in practice, prices can "go smoothly" through the levels discussed above, which are only potential areas of possible support or a likely reversal;
Fibonacci levels are usually used in combination with other technical analysis tools that give greater confidence to trading signals;
"Fibo grid" should be stretched from the initial to the final point of the already clearly formed price pulse.
Fibonacci fan
This is another popular tool for technical analysis, based on the Fibonacci levels discussed above. It is also used to determine potential levels of support and resistance, as well as possible areas of the trend reversal.
Graphically, it represents several inclined lines emerging from the point where the price pulse begins. These lines pass through several key Fibonacci levels, including 38.2%, 50% and 61.8%.
The graph below shows that, just as with the Fibonacci levels, the minimum value of the price with an uptrend is chosen as the starting point (A) for constructing the fan. Specifies the levels of the maximum value of the price (B).
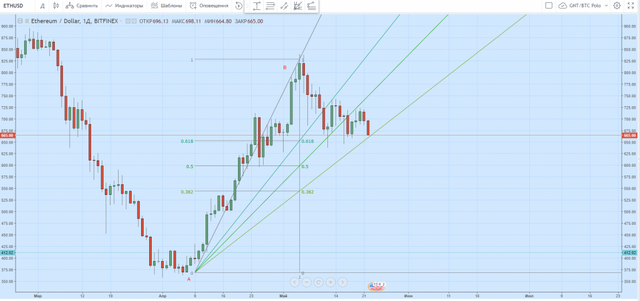
So, if you draw a vertical line from point B, you will get points of intersection with the key Fibonacci levels - 38.2%, 50% and 61.8%. If from the starting point A draw lines through the points of contact of these levels with a vertical line, you will get something that looks like a fan.
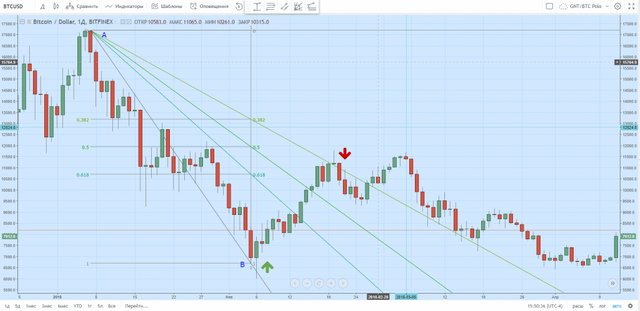
It is not difficult to guess that, as with the levels, in the bearish trend, the Fibonacci fan will be built from the maximum point to the minimum. This is shown in the figure below:
The green arrow indicates a good time to open a long position after the price rebounds from the level up; red - to fix the profit after the price is repulsed from the resistance.
The strategy of trading using a fan is essentially the same as in the case of Fibonacci levels. The only difference is that these levels are not displayed horizontally, but at a certain angle.
Traders recommend not to rely solely on this tool, but use it in combination with other indicators of technical analysis.
Fibonacci extension
If the above two relatively similar tools help to identify only levels of support and resistance, then the tool "Fibonacci extension" allows you to assess the possible scale of the forthcoming price pulse.
In other words, the "Fibonacci extension" is an auxiliary tool used to determine potential support areas, resistance or price reversals in the future. This tool largely corresponds with the Elliott wave theory, as it is used to predict the moment of the end of the price wave.
Unlike levels or fans, the "Fibonacci extension" is built not by two, but by three points - along the line of the initial price pulse and the subsequent correction. With an uptrend, the minimum price is chosen as the starting point, and the maximum value for the descending trend.
On TradingView service this tool is called "Trend-Based Fib Extension". It allows you to build a "grid" in three mouse clicks.
The figure below shows that the baseline AB is plotted along the direction of the main trend. The second wave (BC) is a correction of the previous price movement, and its completion at point C serves as the initial (zero) level for the construction of the "Fibonacci extension".
"Fibonacci extension" in a downtrend, constructed along the dotted line of the ABC curve. Deferred from the zero point, horizontal lines indicate future potential levels of support and resistance.
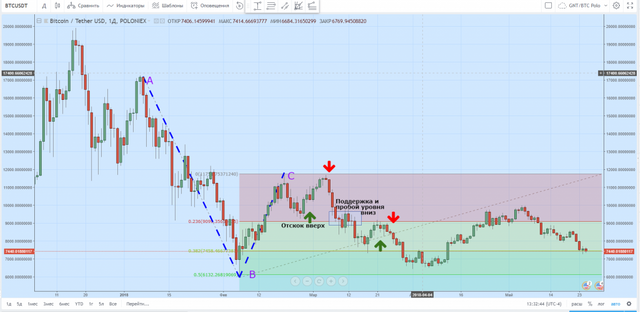
The graph shows that the price "walks" from level to level, pushing it up and down. This zigzag price movement creates good opportunities for short- and medium-term trading. In such situations, limit buy orders can be set slightly above the support levels, and orders for sale - just below the resistance levels (green and red arrows on the chart).
However, do not forget that this is only an auxiliary tool and it gives an opportunity to see only future potential levels of support and resistance, as well as turning points. Traders should be especially careful when the prices approach such levels.
source: https://forklog.com