Trends: How to determine the direction, its strength, stage of the life cycle and reversals - Fill Your Bags in the Bear Market!
(Check out my previous article - The Cycles Of Bitcoin - Get Ready for a paradigm shift!)
Trends are very important. This is not the only thing your profit depends on, but that is the origin. Even if you choose the right coin, calculate the risks and position volume, but have not predicted the trend, or have predicted it, but lose the turn, the loss is waiting for you.
.png)
Today you’ll find out:
-the life of the trend and its life cycle,
-boosting and slowing down,
-4 ways to determine the direction
LIFE TREND AND ITS LIFE CYCLE
Trends are usually distinguished by their lifetime: time period for performing the analysis. According to this option, they may be divided into:
a) short-term — from 1 day to 3 months;
b) medium-term lasts from 3-6 months to a year;
c) long-term — lasting more than 1 year, on average 2 - 2.5 years.
You should analyze the life cycle of a trend in order to determine the trend’s life. It is very important to determine accurately the length of the cycle and its amplitude.
Trend Life Cycle:
a) the beginning of life — birth, childhood, and youth;
b) mid-term — maturity;
c) the end of the trend — old age and death.
The most profitable phase of the trend is usually the middle of the trend — due to speculation.

Therefore, it is important to enter, and it’s not so important if you have time to recognize the beginning of a trend or not.
If the trend dies, you should open carefully. You risk not only not to earn, but also face significant losses if you miss the trend reverse.
How to recognize the life cycle of a trend:
Signs of the cycle beginning:
-growing number and volume of transactions.
-Oscillators, we’ll discuss it later, start to deceive you.
-The beginning of the trend is the third part of the total cycle length. During the first period of the life cycle, prices on average change from 1/4 to 1/3 of the total fluctuation and moves from 1/5 to 1/4. The new trend may form as a result of the flow of capital among whales. In this case, in the middle of the first cycle, the first usually small part of private investors join the whales.
The main feature of the middle “maturity” of the life cycle of the trend — the first signs of market fatigue. The market is overwhelmed and wants to rest:
-A decline in activity comes, but, as a rule, the price does not reach the levels of previous quotes.
-A price often soars, even higher than at the beginning of the life cycle. At this moment that the shock wave of speculators joins the pioneers of the new trend, which brings a huge mass of funds to the market. The market can “overheat”, even more than in the first period of the life cycle. At the end of the second period leads to a decrease in quotations to a level close to the starting level. The quotes for the second period change from the whole to 3/4 of the whole amount of fluctuations, and then slides down from 3/4 to 1/2.
The end of the trend and its signs:
-The amount of free speculative funds begins to decline.
-It also affects the reduction in the number of transactions.
The price does not change like in the second period, and generally lives quietly, as a rule, without sharp fluctuations
-Prices reach a turning-point (upward or downward), stay there for an insignificantly short period, and the last fluctuations occur close to the top.
-At the end of the last life cycle on the market, nervosity increases: sharp multidirectional price fluctuation begins. This is how it gets ready for a new trend.
It is recommended to enter long-term transactions, starting from the second life cycle schedule and up to the first half of the last life cycle.
On the graph, the life cycle of a trend looks like this:
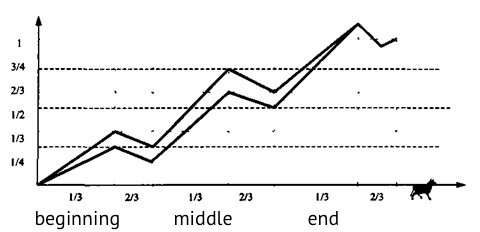
The life cycle of the bullish trend
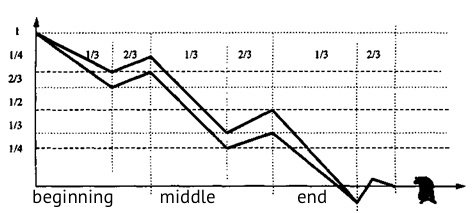
The life cycle of the bearish trend
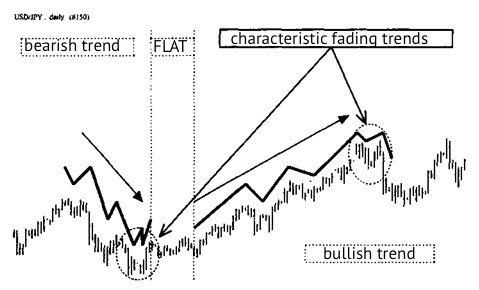
Trend reversal locations, double bottom, and top on the chart
It may seem that trend lines, figures and models provide a simple analysis method, and this is true. Behind this simplicity lies a lot of information.
Lack of attention during a trend analysis can lead to very disastrous consequences. If you miss a key level breakthrough, you will build all your analysis on false market impressions: the situation has already changed drastically, but you haven’t notice it, but your funds will. Such moments can appear during the trend reverse and its acceleration, at this time the support line becomes the resistance line, and vice versa.
Trend lines and models describe show you a mountain, on which the quotes rise during a bullish trend, or from which they fall with a bearish trend. They can point to ways along which the price can move. Your task is to follow the price, otherwise, you have a great chance to fall from the mountain or get lost.

TRENDS ACCELERATION AND DECREASE
Acceleration shows the strength of the trend. You should wait for the trend to continue the acceleration occurs.
On a bullish trend, the acceleration looks like an increase in the inclination angle of the price dynamics. On the bearish market, as a decrease in the angle of inclination:
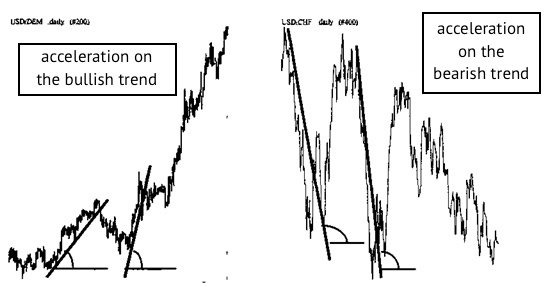
Acceleration trend on bullish and bearish graphs
To check the acceleration or deceleration on a bull trend, it is better to build a line on the bottom of the price. On a bearish trend, this line is best drawn along the upper price peaks.
Slowing is different. First, it means the possibility of a trend entering the flat or even reverse.
Secondly, the angle of the graph indicates the opposite. On a bullish trend, we can talk about slowing down if the angle of the price chart decreases. The bearish trend if the angle grows. Check out the chart:
The trend is slowing down on the bullish and bearish charts
Look at the points “A”. The price of the reverse movement reaches a new level: on a bullish trend — a new bottom, on a bearish one — a new peak.
Upward and downward trends can be used as a good confirmation in case of analyzing the life cycle of a trend. Feel free to use it on any time periods of the analysis.
How to determine the direction of the trend: moving averages, trading volume, oscillators
According to the parts above, the trend direction is not a mathematical pattern — it is largely determined by the psychology of the traders which influence the mood in the market. Nevertheless, they mostly use the same set of tools to control the movement of the trend. It is believed that as long as this continues, these tools will work. They can be divided into 4 large groups.
1. Trend lines
One of the simplest and working indicators for technical analysis.
The trend line can move upward and downward. The ascending line on the graph is plotted up from left to right, it goes through a series of recessions, increasing one after the other. The descending line can be built down from left to right, it runs through successively descending peaks.
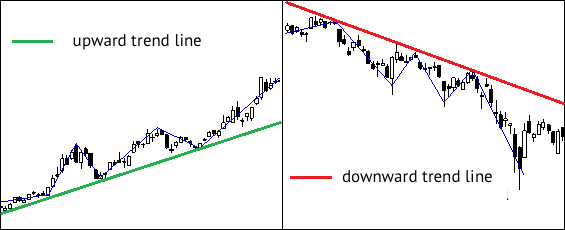
To build this line, you need to find at least two high or low point that forms a trend. For the descending boundary, it is necessary that the second peak should be lower than the first. For the ascending boundary, you need to define at least two points of recession, the second one should be higher than the first.
But this is not enough. You need to find confirmation or admit that your assumption was wrong. in order to confirm the viability of your line, you need a third touch point — then the border can be considered confirmed, and the price level is strong. The more price touches this line, the more effective it is.
But this method looks a bit subjective. It gives each trader creativity to build lines in his own way, to connect unequal extremes, to change the inclination angle of the trend.
The price is on the dark side: it often deviates from the ideal movement (well, we are not perfect), and different traders use this shift in different ways. It is important to know about this method, but building a trading system based on it, is a bit risky.
2. Moving average
The moving average reduces slightly the subjectivism of the previous method and helps to determine the trend objectively. The price moves all the time close to its mean value and always strives towards it, deviating in different periods in one direction or another.
Therefore, it is considered an objective price tracking relative to the mean value. How it works: two moving averages are superimposed on the 15—minute chart: for example, with a short-term weekly interval, and a long-term, for example, 20-day one.
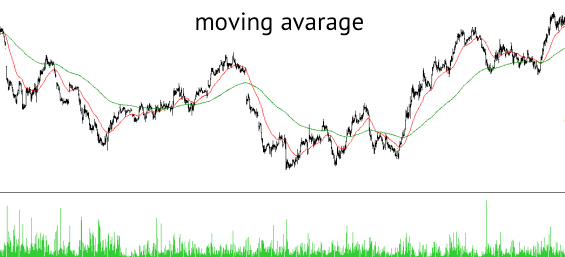
Red mark on the chart indicates the short-term moving average.
Piercing of the line is a signal of a trend change if the short-term moving average falls below the long-term. It is possible to change the bullish to the bearish mood and most likely it is time for the short. Moreover, if the short-term rise above the long-term, this may indicate an increase in the bullish trend and it is worth thinking about long.
The problem is that the moving average indicator can be delayed.
3. Horizontal trading volume
The indicator shows the market in terms of the number of transactions for a specific time period.
This shows the strength or weakness of the trend. At different stages of the life cycle, traders show different interest towards the coin, this can be expressed in different trading volumes.
The horizontal volume defines determines the zone of value and shows where the current price is relative to this level and, based on this, predict the direction of the trend.
How it works: a couple of words about the cost zone
This is the maximum trading volume for the period. You can see it in the number of coins: how many units of goods were traded during the time period.
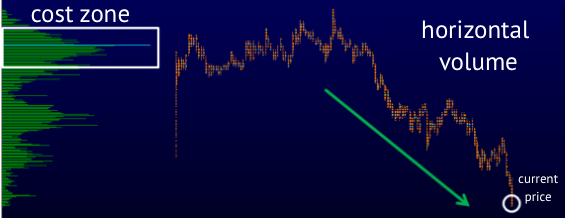
A horizontal volume histogram can be plotted from the side of the graph. Vertical reflects coin value levels. Horizontal — the number of coins involved in all transactions for this period.
A deal on the market — the number of coins that have just been bought or sold is added to the histogram, to a specific price level. The more deals are made near a certain level, the greater the importance of such a price The higher the trader's interest, the stronger is the price level.
The level of the highest trading level for the period — the cost zone.
How to determine the trend using the specified indicator:
If the price level is above the cost zone, in the medium term, priority should be given to purchasing, if lower, then to a sale. It shows the direction of the trend.
Once the cost zone will move, that means that a volume has accumulated higher than the volume of the previous cost zone. A new phase of the movement will start from the new level, and further, like in the old joke about the dinosaur, you will either meet it or not: the trend will continue, or it will turn around.
This method is the strongest but it is good if it is combined with the second, then the signals perform better.
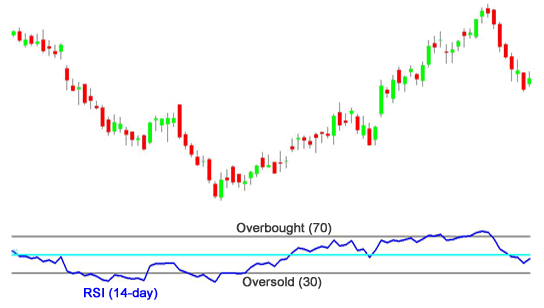
4. RSI
The world of oscillators begins with it — a world full of wonders. This is a group of indicators, which since the 1950s has been used to determine the direction of the trend and to predict pivot points.
RSI is one of the key oscillators used throughout the world. Like any oscillator, it works on a strong trend, and it is inefficient in a sideways movement.
The indicator takes the closing prices for a certain period of time and calculates the strength and amplitude of the price. It can appear when the trend is no longer valid and unfolds. RSI signals can also be connected with your bots on 3commas.
The easiest way to work with the indicator is to focus on the price range. If the value of the coin goes into the overbought zone — you should buy, if it enters the oversold zone — you should sell.
What we’ve learned today:
1. A trend is a small life for the thoughts and emotions of many traders.
2. Your profit or loss amount depends on the correct determination of the trend direction, and its reverse.
3. Trends differ in terms of their lifespan, the short, medium and long terms exist.
4. Trends live almost the same as the plot of a good book: the plot — the climax — the denouement.
5. It is important to identify correctly the stage of the life cycle of a trend: the main profit usually falls in the middle of the trend, if a large number of players joins.
6. At the end of each phase, quotes may move back, or move back partially, close to the original levels — if this happens, the price will follow a different “path” at different stages of the trend life.
7. The third phase is “agony” in the sense of price extremes and time, how much they keep on peaks, and different directions of value fluctuation.
8. Long—term transactions are recommended to be concluded between the second stage of the life cycle and up to the first half of the last life cycle.
9. Acceleration and deceleration indicate the strength of the trend. The appearance of acceleration indicates the continuation of the trend.
10. The acceleration looks like an increase in the angle of inclination of the price dynamics, during the bullish trend. During the bearish trend — looks like a decrease in the angle of inclination.
11. You can start working with a trend with indicators of moving averages, trading volume and RSI, which shows the strength of the trend and its readiness to turn around. It is also important to understand the trend line, but work carefully with them, the best way is to check with the opinion of more experienced traders. You can check it in the chat for traders.
My other Steemit articles on 3commas, how to use this powerful fintech, and strategies and configurations I personally use.
(9 trading strategies for newbies + Configurations have made avg. 1% per day)
(3commas BOT, Disrupting crypto trading! Review, Full How-to & Profit Strategy 🤖🚀)
(Get Started with your 3commas Risk-Free free Trial)
Trade with confidence with TakashiClub Signals, and identify the best entry and exit points for your trades. Get 10% off with my referral code: https://takashiclub.com/create_account.php?ref=joshmillerminds
Best crypto exchanges get a signup bonus
Join Binance with me: https://www.binance.com/?ref=35181698
Better than Coinbase Get $10 of free Bitcoin through Coinmamma - http://go.coinmama.com/visit/?bta=55219&brand=coinmama
BEST Bitcoin faucet check out my last post! - https://freebitco.in/?r=320572
Get CryptoTab Browser: https://get.cryptobrowser.site/4629357
Earn free BTC with Moon Bitcoin- http://moonbit.co.in/?ref=c69b1e844696
Best Altcoin exchange, LIQUID- Trade with leverage, earn interest! -- https://www.liquid.com?affiliate=nzUv3Q_d637816
10% off fees on Bitmex trading for 6 Months- Trade with up to 100X leverage - https://www.bitmex.com/register/SO6J4s
2 of the most effective crypto advertising platforms below
Advertise and earn faster for Cryptotab or any crypto Referrals- https://ref.adbtc.top/959159
Advertise and earn faster for Cryptotab or any crypto Referrals- http://www.easy-hits4u.com/?ref=jam199716
Check out Bitcoin Hex Before the launch - Get ready for this massive airdrop! -BitcoinHEX.com
BTC- 17iN9xNLU4EFvBVCbuB9cz425EL8tuZnJb
ETH- 0xFC18Dc7Cf9f1340C7d2Aa6771176C6580aBc2651
This is awesome! I've been learning this, and this just made it click! thank you, keep up the GREAT content! Can't wait to apply this to my 3commas account!
This post was upvoted and resteemed by @resteemr!
Thank you for using @resteemr.
This post was upvoted and resteemed by @resteemr!
Thank you for using @resteemr.
@resteemr is a low price resteem service.
Check what @resteemr can do for you. Introduction of resteemr.
This post has received a 6.69 % upvote from @boomerang.
The next bull run will kick off early next year. 2019 will be mostly accumulation with some ups & downs. Fill up your bags while you can! Within two years most of your bags will be up 500% or more
You got a 100.00% upvote from @botcoin courtesy of @the.success.club!
felicitaciones
Did you try logging with @the.success.club ?
Do you have another account you would like us to whitelist?
Thinking maybe the dots in your name could cause issues.
You should just try again first. I know we've been going in maintenance mode a few times around that time.