Zilliqa (ZIL) Analysis 5/11 ZIL-BTC
Zilliqa (ZIL / BTC), the young token since the beginning of 2018, can look back on a successful ICO. Although ZIL was unable to avoid the general downward spiral in the crypto markets, the coin was relatively stable.
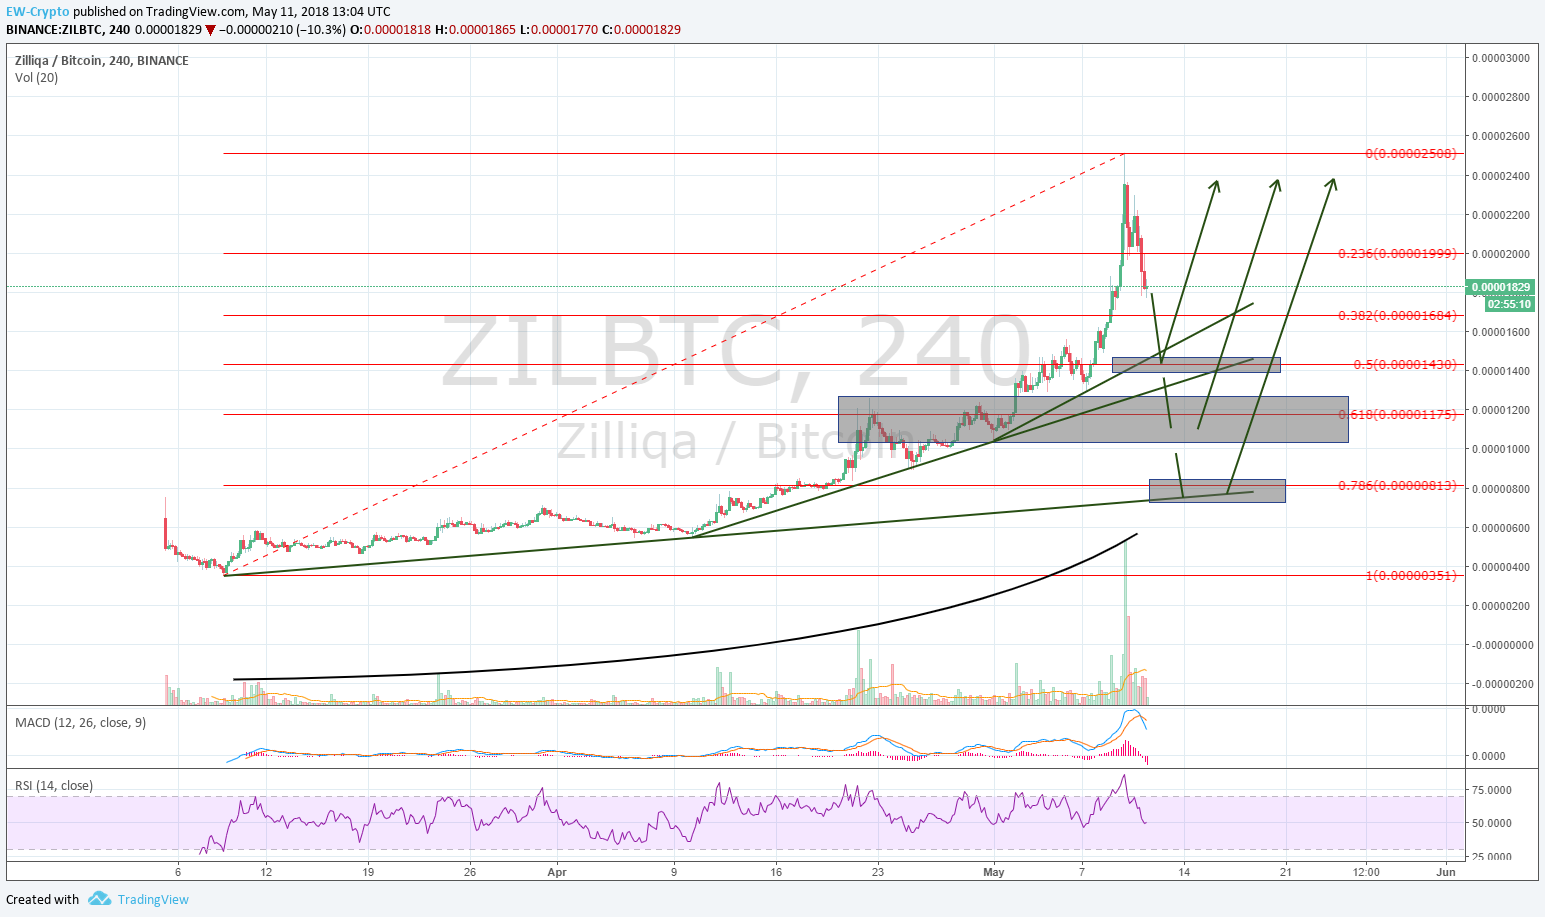
On March 9, the price hit a low at 0.00000351 BTC. Since then, the price has rebounded and rose rapidly in recent weeks. Up to the top reached yesterday at the price level of 0.00002508 BTC, the performance is approximately 600.00 percent.
(Important Note: Stock data has only started at the beginning of March 2018 at Binance, the highest selling marketplace. In addition, a US Dollar or Euro indication is currently not available, so ZIL's share price has been measured by Bitcoin!)
What immediately stands out in the price chart is the massively rising volume at ever higher prices, which is very bullish. The course trend is getting steeper in the course. With yesterday's peak, however, there is the potential for correction potential before the price rises to new heights.
The illustrated three marked areas represent the regions where the price in the correction can usually go. Worst-case scenario is a pullback to the large lower trend line in the range of 0.00000813 BTC. There, in addition to the trendline, the 78.6 Fibonacci retracement is also supported there.
This is NOT investment advice and does not require buying or selling. Every reader is aware of this and makes their own investment decision with their own understanding of risk management!
Cheers Jessy