Bitcoin movement in the near future. Down along the trend line.

Hi, Steemians…
Our motto is less words, more screenshots. To begin with the general stock chart.
Timeframe 12 hours.
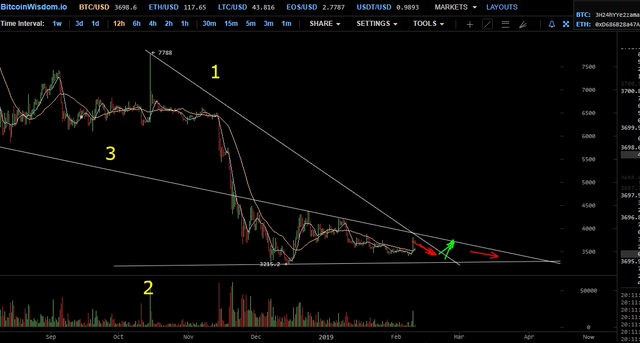
At the moment, the price of Bitcoin is still inside the triangle lines 1 and 2. The price should rebound from yesterday's high down along the trend line 1. Then the price will break through this line and will continue to be within the limits of the triangle of lines 3 and 2.
Now we look at the increased stock chart. Timeframe 1 hour.
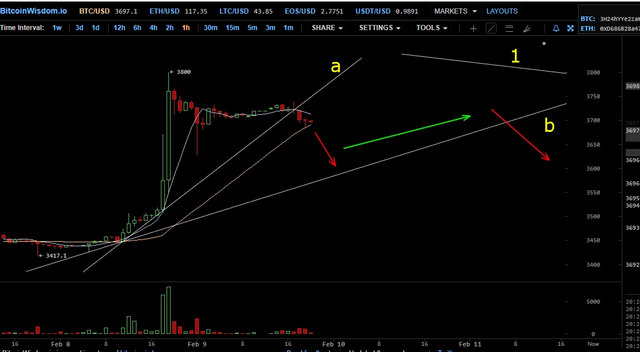
Not reaching the trend line 1 the price began to fall. The local support line "a" has already been broken and now the price should fall to the local support line "b". A slight increase will begin, but then the price will continue to decline along the trend line 1.
We'll have to wait for altcoin jerks.
Thank you for reading and support!
Good luck!
The @upvoteinvest team
A formal disclaimer
Some of the posts might contain our opinion on trading strategies based on our technical and fundamental knowledge. However, please, invest at your own risk. We can’t be held responsible for any losses.