AION/BTC still in bearish wave C
AION is checking support line again. It's in bearish channel and have to break 2 strong resistance lines, to show us some bullish movements. 1st line is an channel line, and second one is trend resistance line.
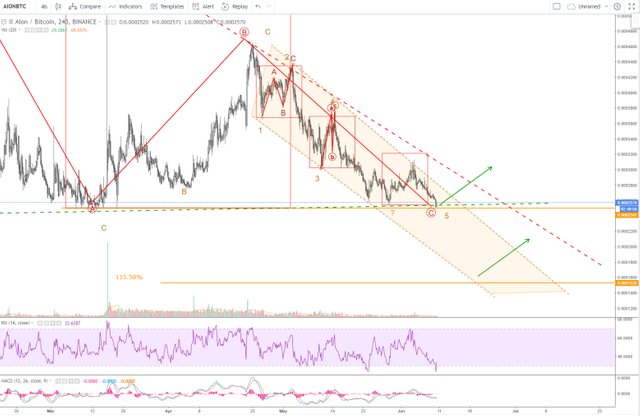
If that green support line will be broken, AION can fall even to 115.50 Fibonacci line. But as long as it's above that green line, we dont have to worry about it.
In my analysis I'm using Fibonacci Levels, Elliott Wave principles, Support and Resistance lines, Candle Patterns and formations, like Head and Shoulders or Triangles.
DISCLAIMER
I’m not a certified financial advisor nor a certified financial analyst nor an economist nor an accountant nor a lawyer. The contents posted by me are for informational and entertainment purposes only. Don follow any analysis blindly, and make your own decisions. Always plan your trades and play with stop-loss.
If You like my charts, follow me on Twitter https://twitter.com/Woytech
or on TradingView https://www.tradingview.com/u/Voytech/