Bitcoin Drops! Is the correction finished or will it drop further?

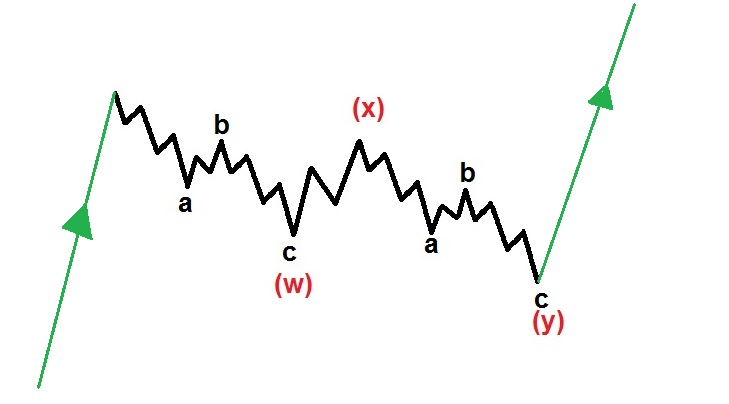
If you've been following me, you know I've been saying bitcoin is in a WXYXZ pattern. I'm revising my past bitcoin count slightly to instead label this current correction as a WXY. To recap for those unfamiliar, a WXY pattern connects two ABC corrective patterns. Based on this information, we can surmise that we're currently in another ABC correction. Once this correction is complete, it'll complete the "Y" portion and we can expect another attempt at an impulse wave up.
Looking at the 4 hour chart, this is the count I see that makes the most since:
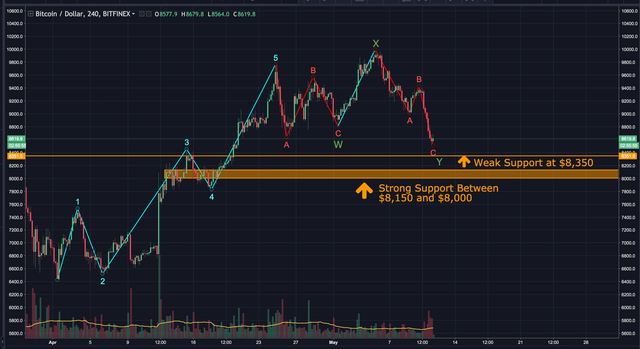
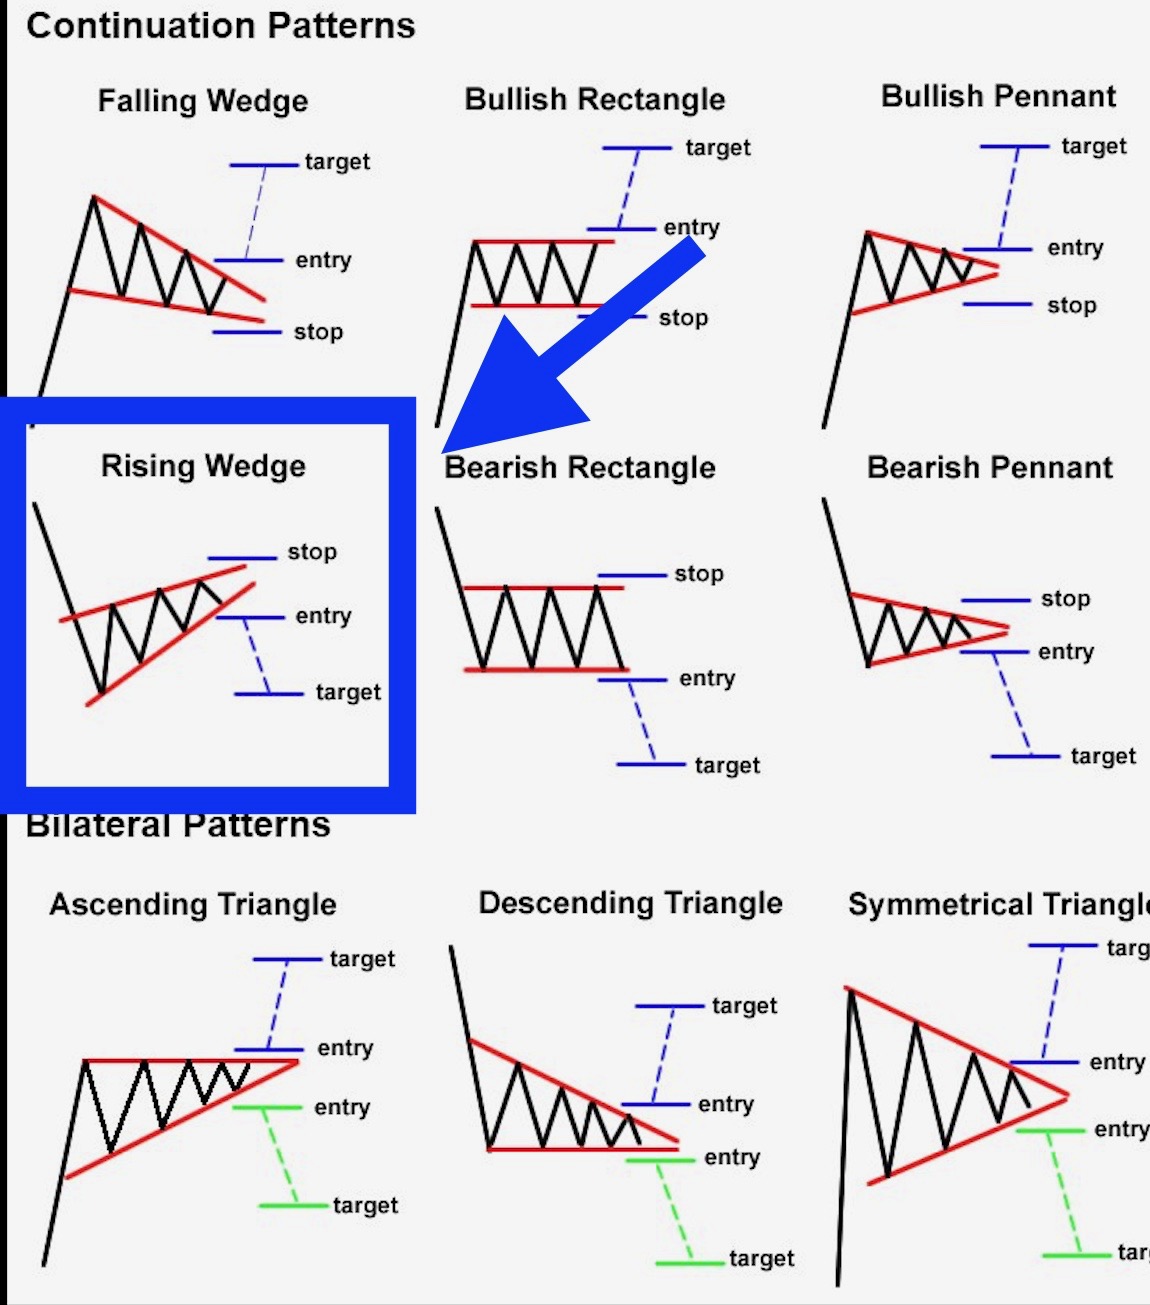
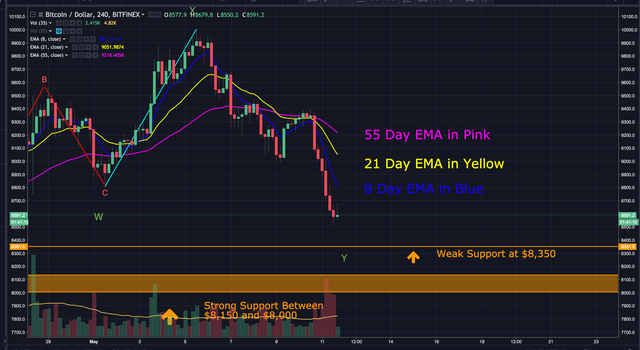
We have weak support at $8,350. Wave C may or may not drop further. Zooming into the 30 min chart, we can see a rising wedge has formed. This indicates a possible further drop.
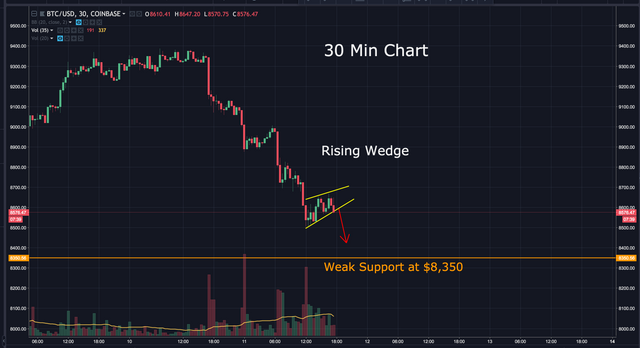
I would expect a possible landing zone between it's current price and the $8,350 support. We'll know wave C is complete if/when another impulse wave up is attempted. That impulse wave should target approximately $9,500 and may play out like this:
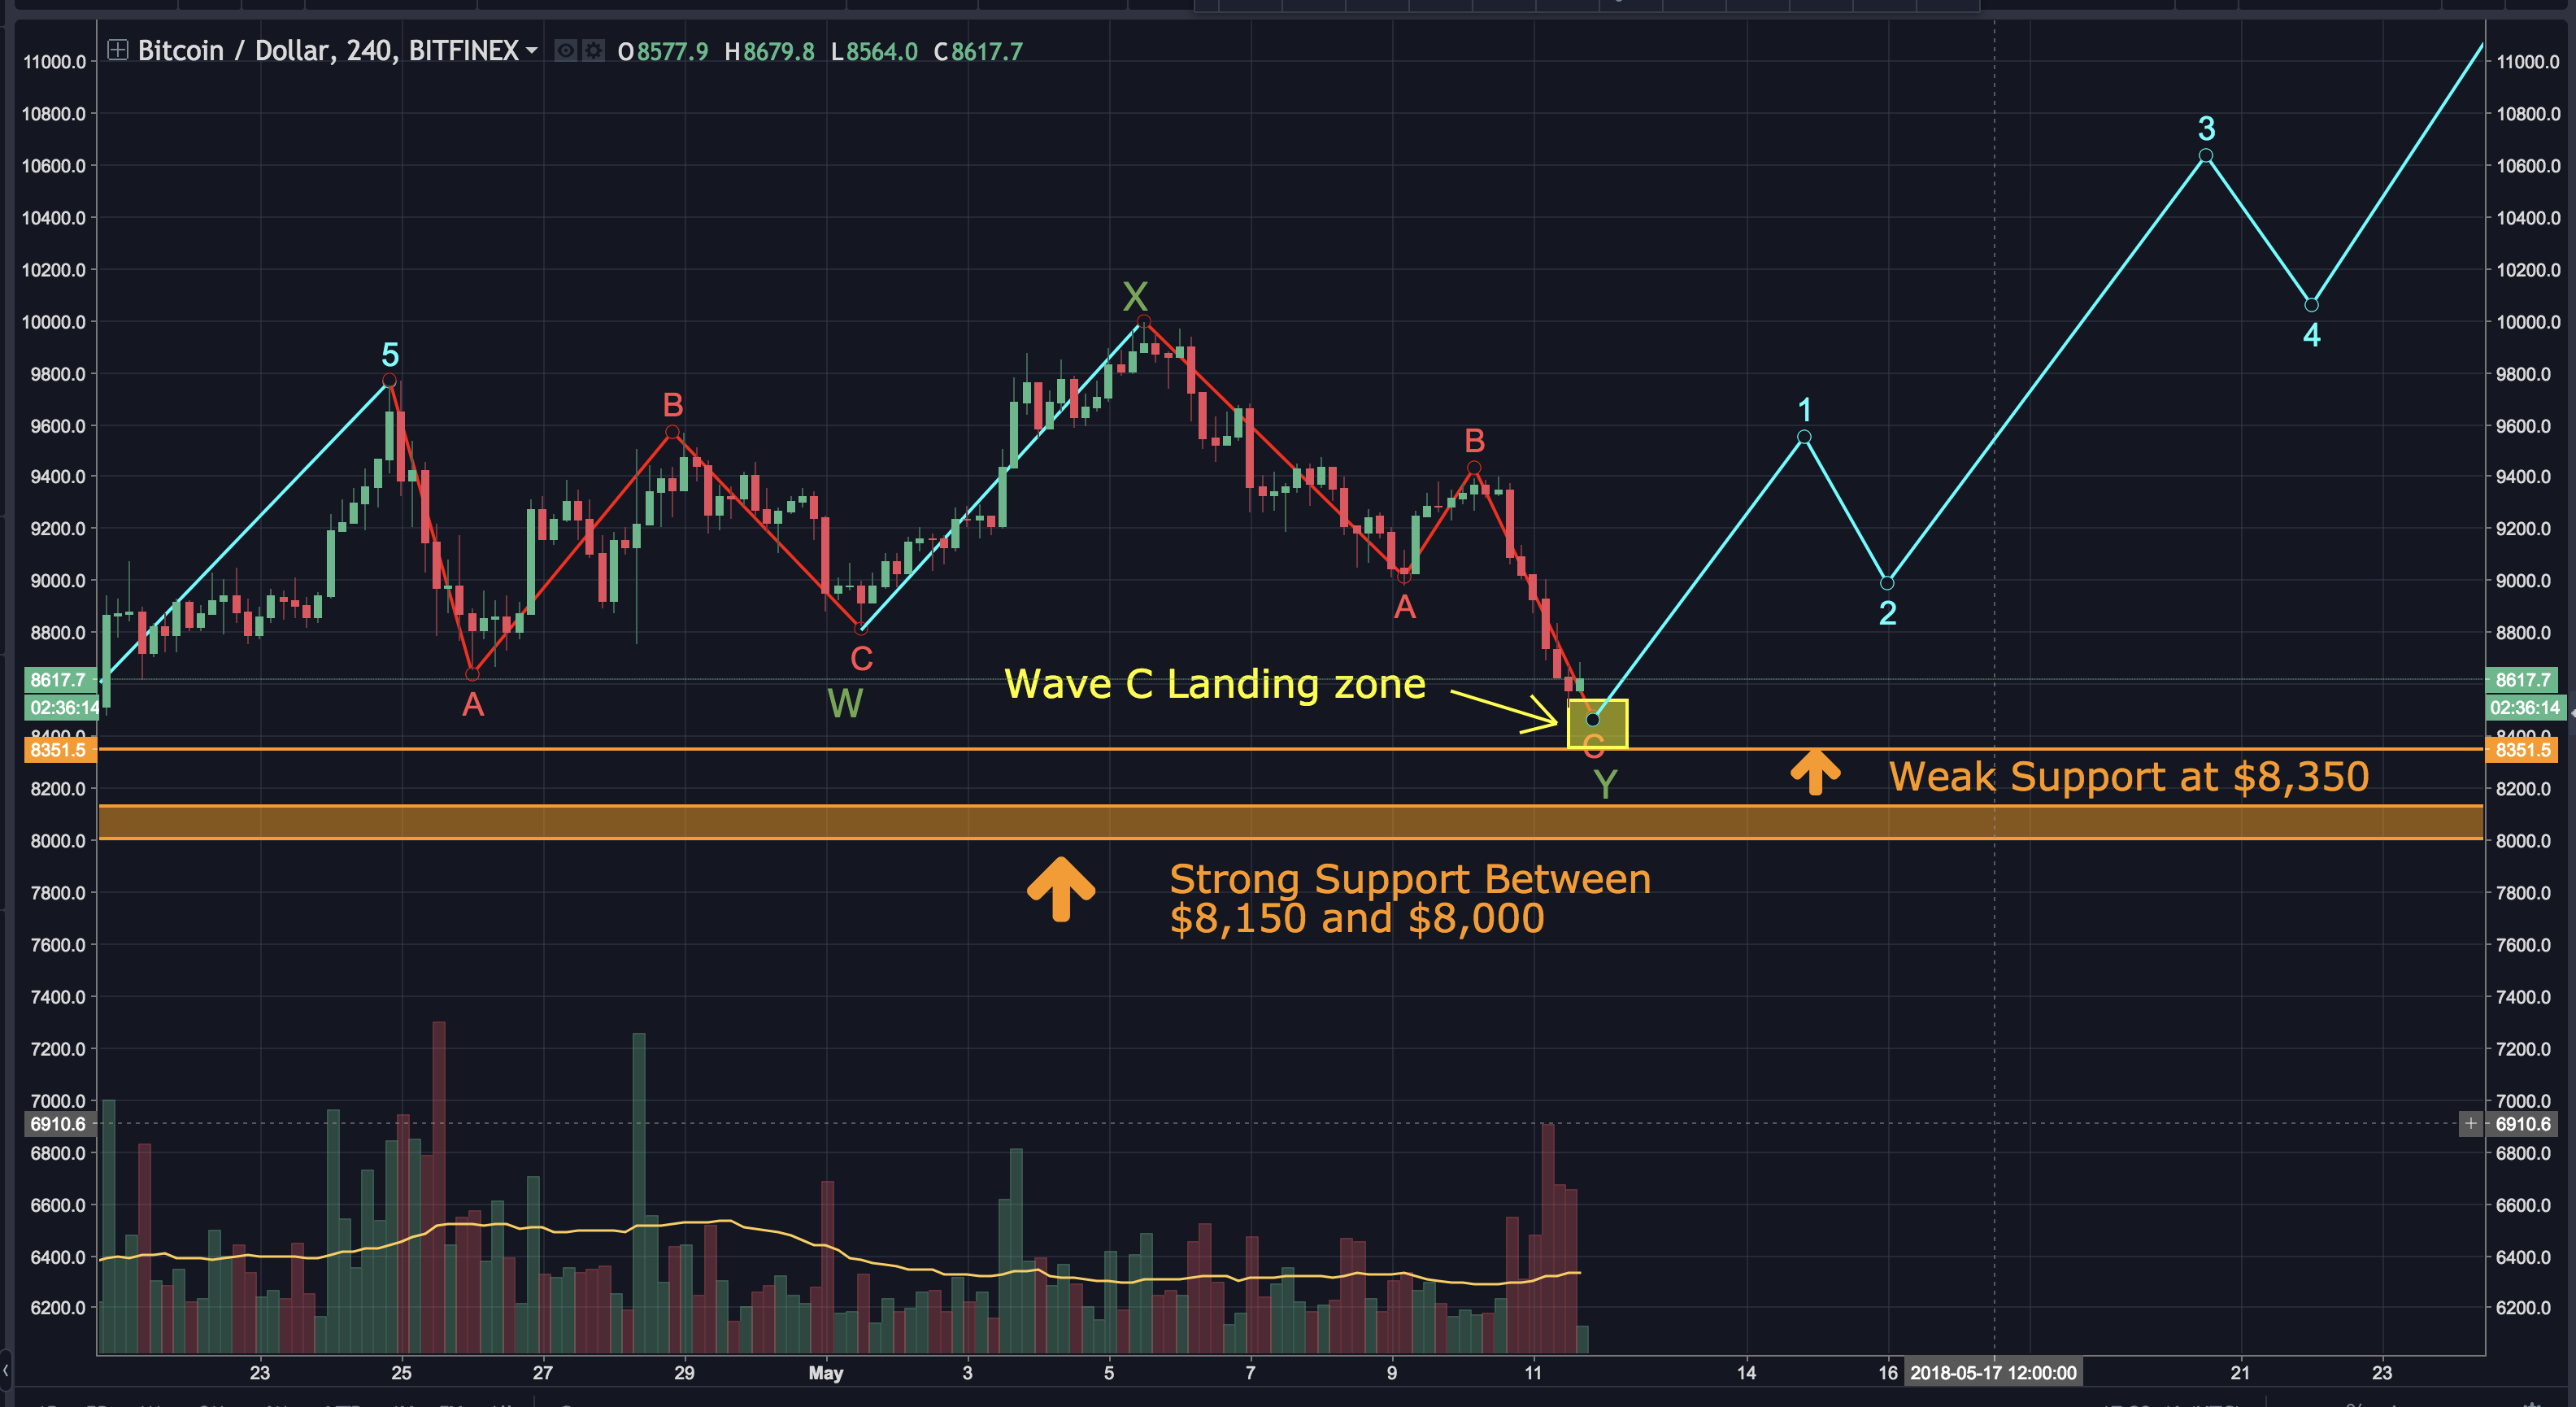
There is also a very strong support zone between $8,150 and $8,000. Should bitcoin fall under the $8,350 support, I would expect it to be caught by the stronger support zone below.
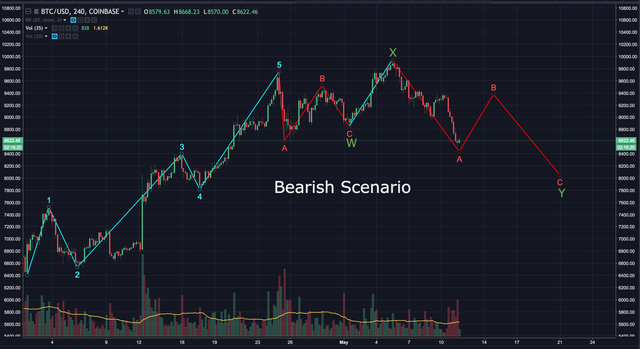
A more bearish scenario could have this entire drop counted as wave A. If that's the case, we're in for a long corrective pattern before bitcoin attempts to break $10K again. It may look something like this:
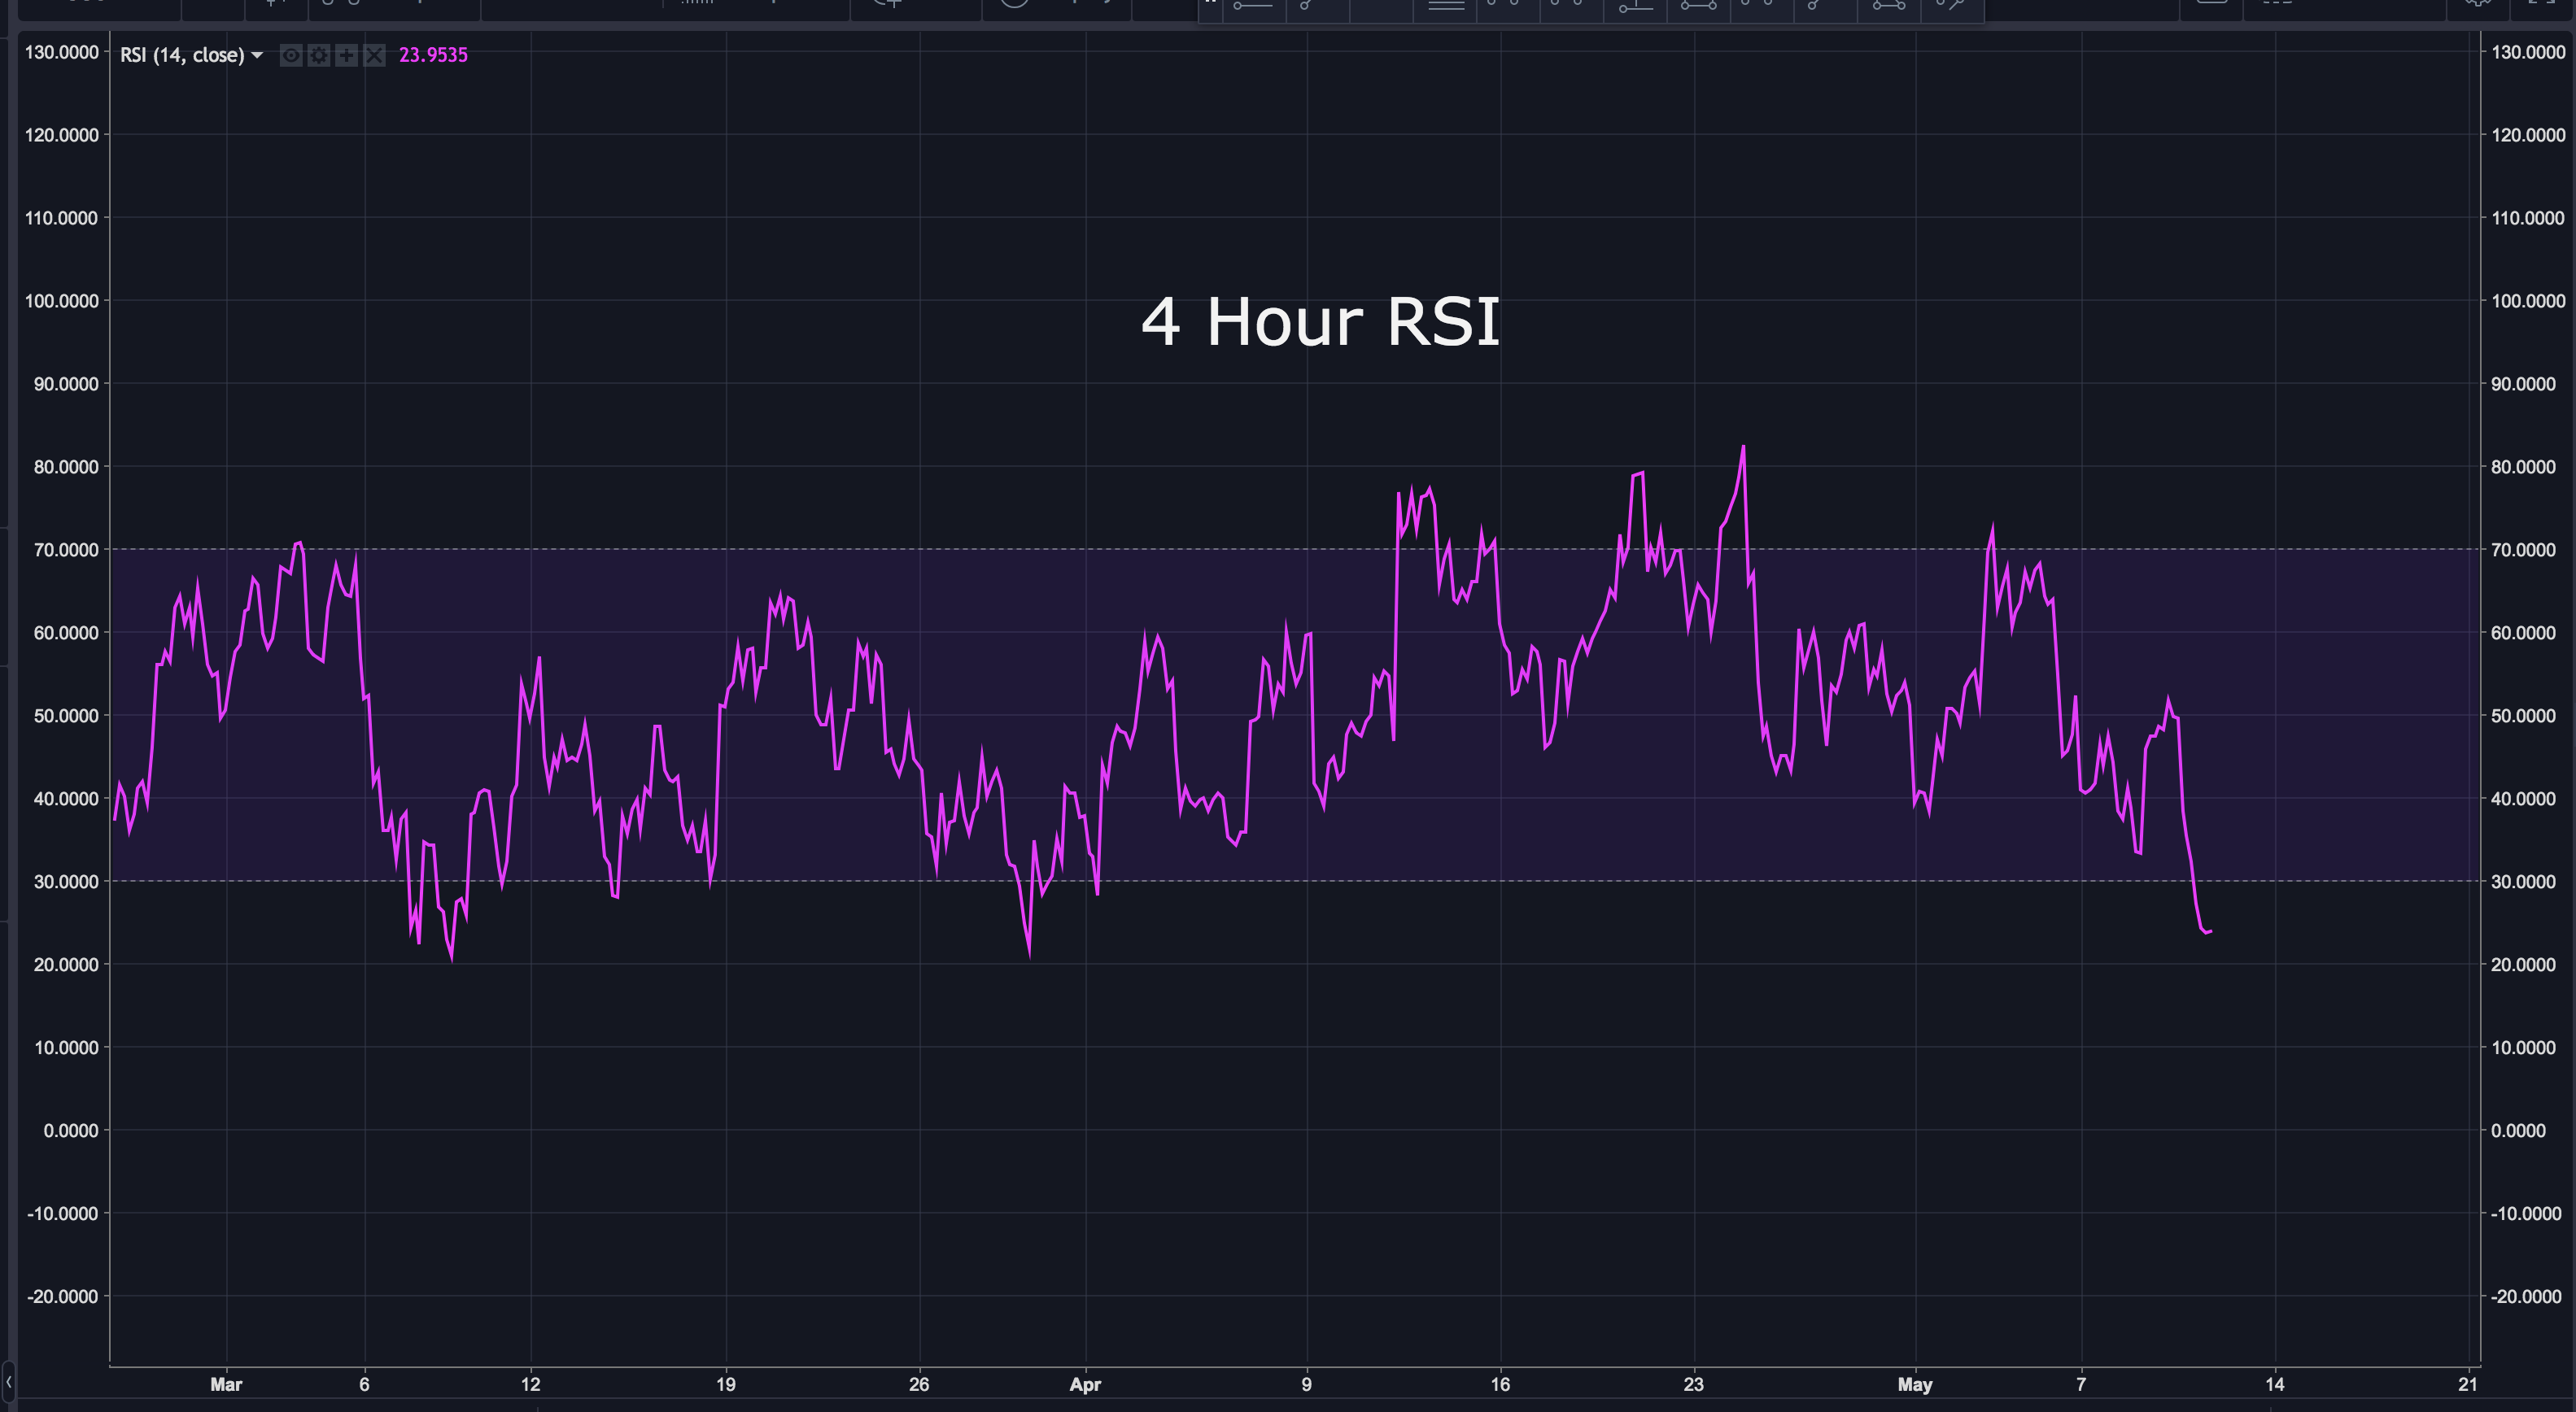
Looking at the 4 hour RSI, we can see it's extremely oversold. This indicates wave C may be nearing completion.
The 4 hour MACD is also oversold, but not yet showing any signs of reversal.
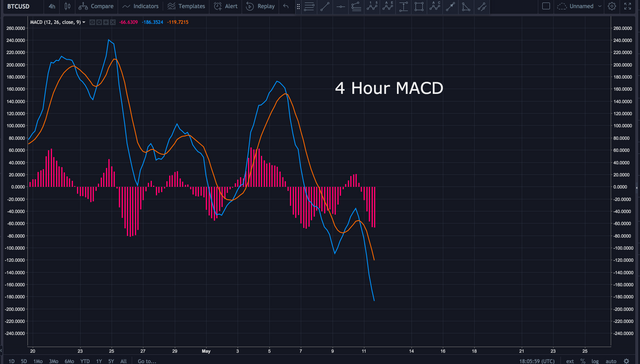
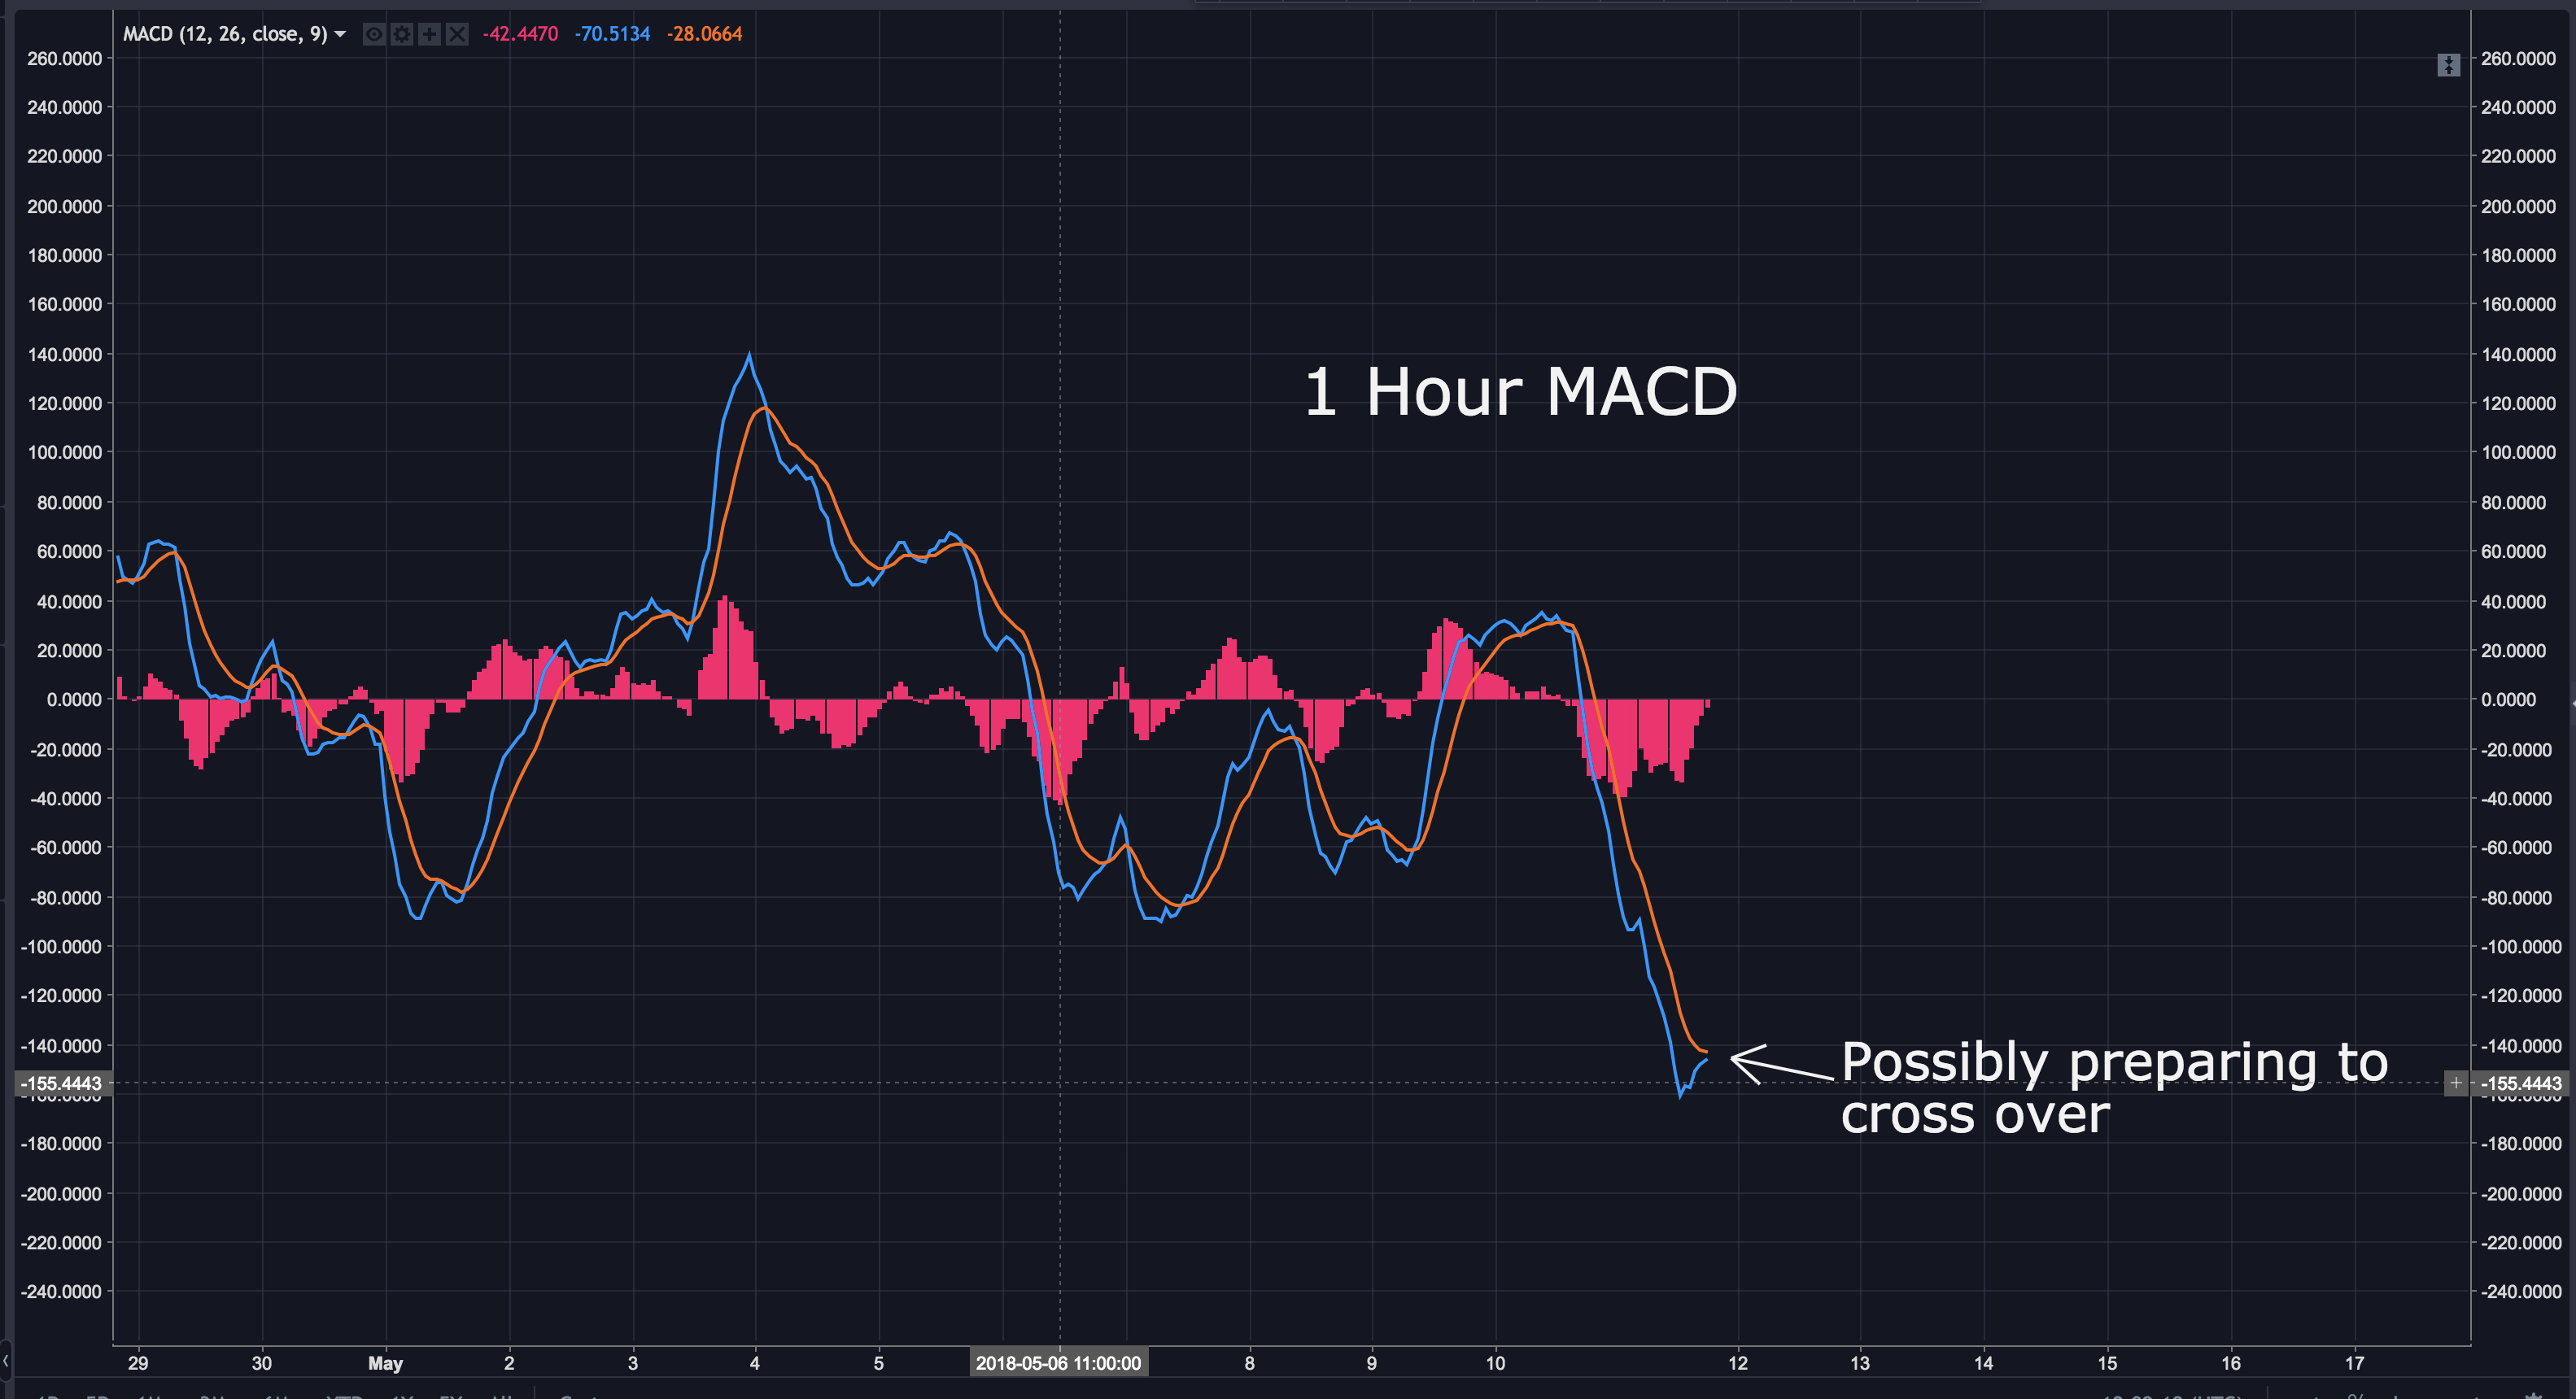
The 1 hour MACD is in-fact showing a possible reversal as the histogram looks like it's about to cross over.
The truth is, this market continues to show many mixed signals. Looking at the 8, 21 and 55 day EMA's, we can see the 8 day is on the bottom, 21 in the middle and 55 day EMA on top. As I've pointed out in the past, this is a good indication of a bear market.
If you aren't familiar with how to use EMA indicators, you can reference my post on the topic here: https://steemit.com/cryptocurrency/@workin2005/simple-effective-strategy-to-buying-and-selling-market-trends
I'm not yet ready to say we're in a bear market, but there are signs pointing in that direction. The fear of the SEC labeling certain cryptocurrencies as a "security" has caused many to pull their money out. As I've been saying for some time now, once we have more regulatory clarity, I think we'll enter a bull market much greater than anything we saw in 2017. Until then, the market is going remain extremely volatile. Personally, I won't be entering any more large positions until there's more certainty.
BIAS:
Short Term: Neutral
Longterm: Very Bullish
I hope this has been helpful. I’d be happy to answer any questions in the comment section below. Thanks for stopping by. I wish you great success!
If you found this post informative, please:

Disclaimer: I am NOT a financial advisor and this is NOT financial advice. Please always do your own research and invest responsibly.
If you don’t have an account on Binance, I STRONGLY recommend getting one. They’re usually the first to get reputable coins, have excellent security and second to none customer service. You can sign up here for free: https://www.binance.com/?ref=16878853
Superb analysis my friend. Let’s hope we get another weekend rise.
Thanks. Weekends are always interesting.
So tired of seeing bitcoin drop linked to other coins. When will this end. Each coin should not be affected by bitcoin. Lets see what happens. Thx again for the info.
I think many of the coins with strong fundamentals (like EOS, Stellar, XRP, VEN, etc...) will break off from bitcoin by the end of 2018. Once they get real world use, they'll rise and fall on their own merit.
Me too, everything is too connected right now, each project needs to spread its own wings instead of being mothered by bitcoin.
I like your analysis, so I will stay with you for sure for some time. Thanks.
Thanks for stopping by.
Awesome point of view. Good Job. Also consensus 2018 is starting Monday. Lets see what it does.
Thanks @guardian2100
Good analysis again. I put the third wave of the retracement down to somewhere between 8,7 and 8,6, although it could still go to 8,2ish, but historically, next weeks Consensus Conference has a positive impact on the market, so hopefully, the first wave impulse will start soon. I agree with your sentiments on the need for a regulatory framework.
Thanks.
I wouldn't be surprised if the SEC gave us some answers in the next few weeks. Maybe before the Consensus Conference. We'll see.