Dent Technical Analysis - 15th May
Daily Technical Analysis Summary for Dent — 15th May 2018
Welcome to the Technical Analysis Summary for Dent — 15th May 2018.
This report investigates 4 popular technical analysis indicators:
- Moving Average Convergence Divergence
- Relative Strength Index
- Aroon Indicator
- On-Balance Volume
The above indicators are used in technical analysis as tools for forecasting the direction of prices through the study of past market data, primarily price and volume.
They are based on the idea that the market for buying and selling digital currencies is not efficient and historic prices can be used to predict future price movements, and using these tools can be advantageous to investors and traders.
Moving Average Convergence Divergence (MACD)
The graph below shows the MACD applied to the price of Dent using daily price data for the last 40 days.
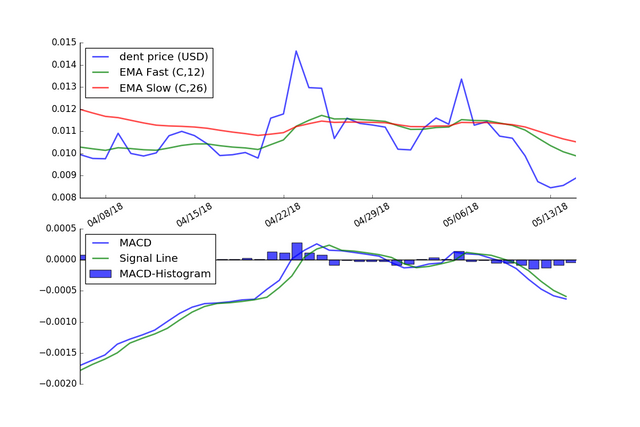
As shown in the chart above, the MACD is currently below the signal line, implying a bearish signal, indicating that it may be an optimal time to sell.
According to the MACD, a bearish signal suggests that the price of the asset is likely to experience downward momentum.
Relative Strength Index (RSI)
The graph below shows the RSI applied to the price of Steem based on daily price data for the last 40 days.
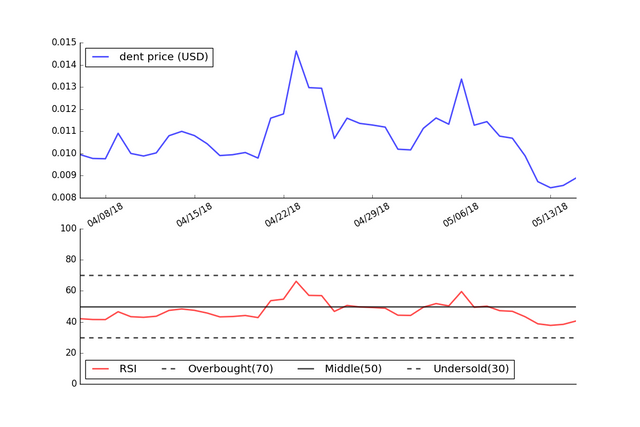
Since the RSI is currently between 30 and 70, this would indicate that Dent is neither overbought or oversold and that no material price change is expected.
Aroon Indicator
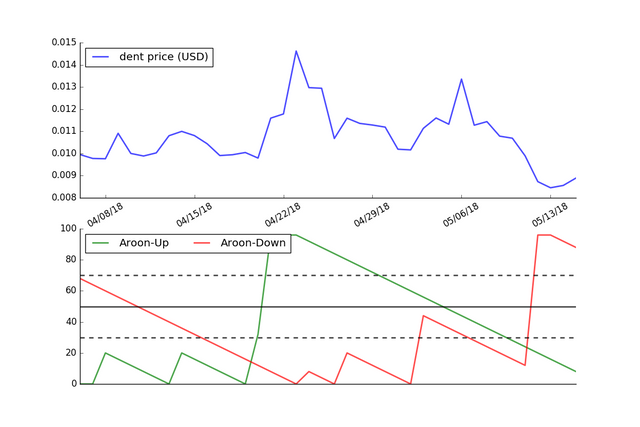
The graph below shows the Aroon Indicator using the price of Dent over the last 40 days.
The Aroon indicators move above and below the centerline (50) and are bound between 0 and 100. These three levels can be explained as follows: When the Aroon-Up is above 50 and the Aroon-Down is below 50, the bulls have an edge. This indicates a greater propensity for new x-day highs than lows. The opposite is true for a downtrend. The bears have an edge when Aroon-Up is below 50 and Aroon-Down is above 50.
In the graph below, the Aroon-Up is below 50 and the Aroon-Down is above 50 indicating a bearish signal.
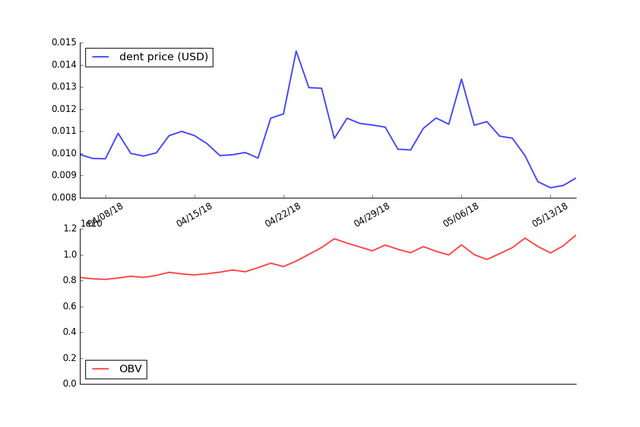
On-Balance Volume (OBV)
The graph below shows the OBV applied to the price of Dent using daily price data for the last 40 days.
Please note that the above indicators can give false trade signals and use of such tools should be treated with caution. Blindly using technical pricing indicators without a general knowledge of fundamentals or an understanding of the currency being analysed is not advisable.
Thank you for reading
Source of data: www.coinmarketcap.com