Smart Money Was FLEEING the Stock Market! THIS Chart Proves Fed Saved Crashing Stocks!
Where is all the money going? There is much contradictory information today. This is particularly evident since the last few trading days in 2018. With the Fed signaling that they will continue to pursue ultra easy monetary policies, what does that mean for equities? Could they rise infinitely, or will a massive trigger event set off the markets on a downward trend?
2019-02-12_6-03-11.jpg (890×470)
2019-02-12_6-06-39.jpg (890×468)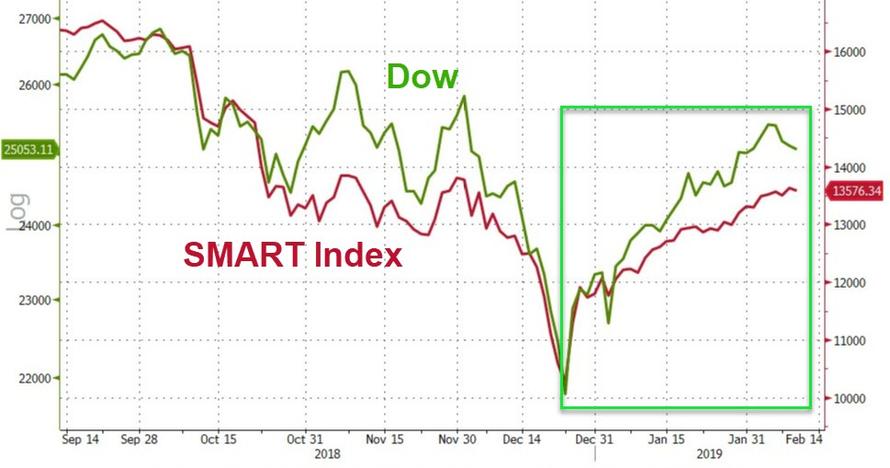
Fed+balance+sheet+vs+smart+money-2.jpg (841×973)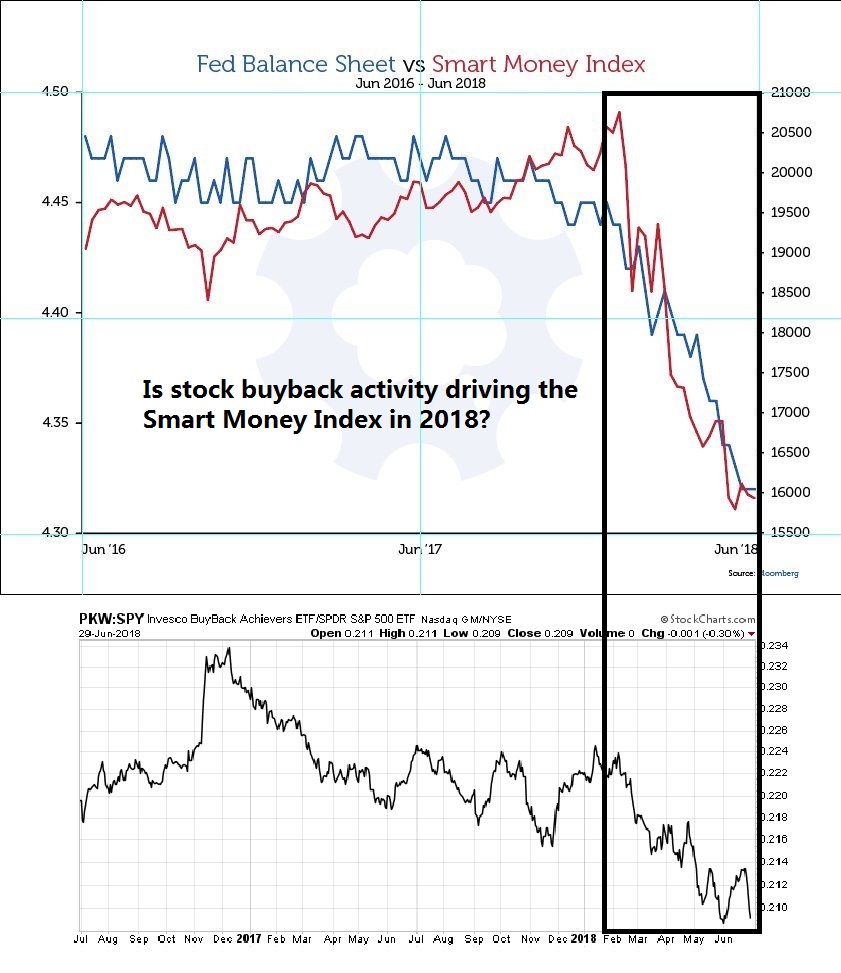
The ‘smart money’ isn’t buying the stock-market bounce, and that could mean a test of the lows: analyst - MarketWatch
https://www.marketwatch.com/story/the-smart-money-isnt-buying-the-stock-market-bounce-and-that-could-mean-a-test-of-the-october-lows-analyst-2018-11-08
021119-Hourly-Peak-to-Trough.png (513×316)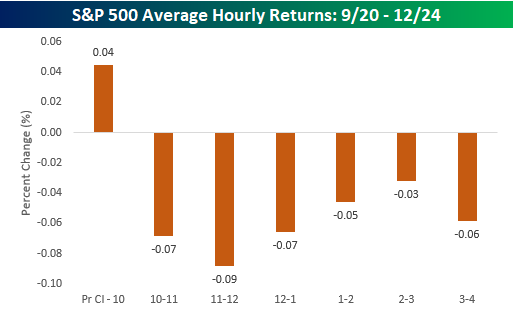
021119-Hourly-1226-.png (515×319)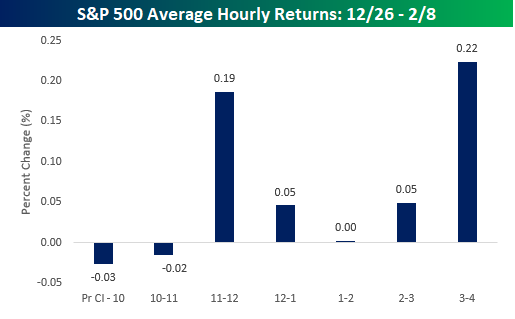
bofa cash allocation 2009.jpg (679×438)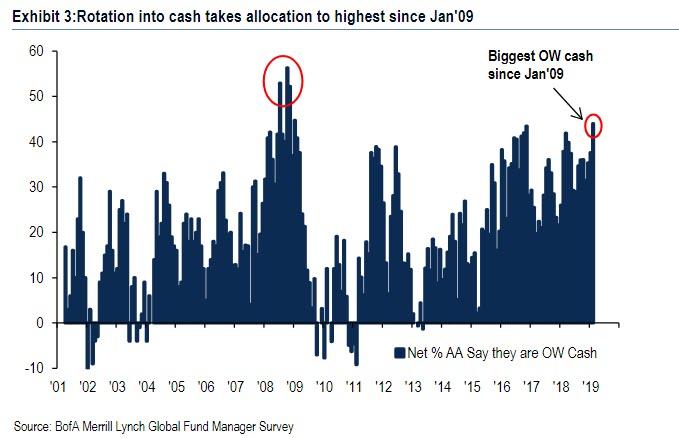
FMS overweigth equities.jpg (729×431)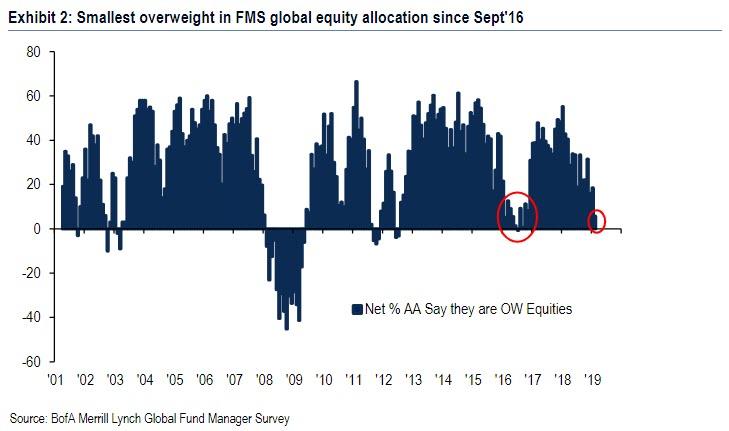
most crowded trade feb 2019.jpg (864×827)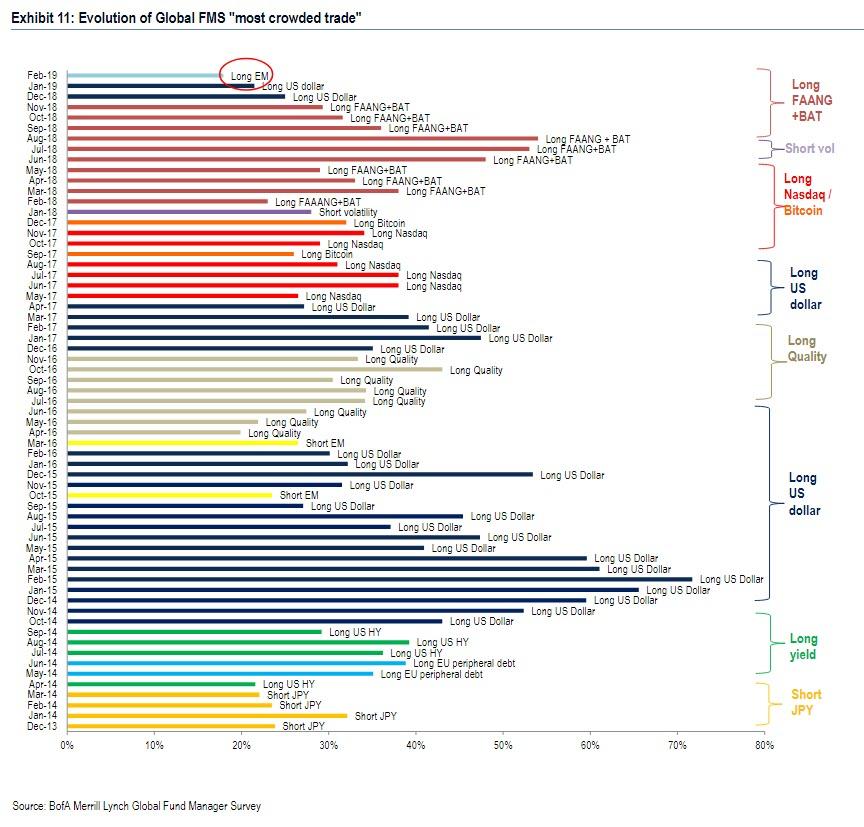
most crowded trade detail feb 2019.jpg (644×323)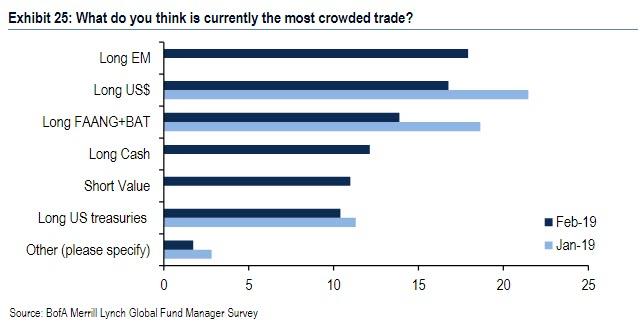
trade war feb 2019.jpg (838×841)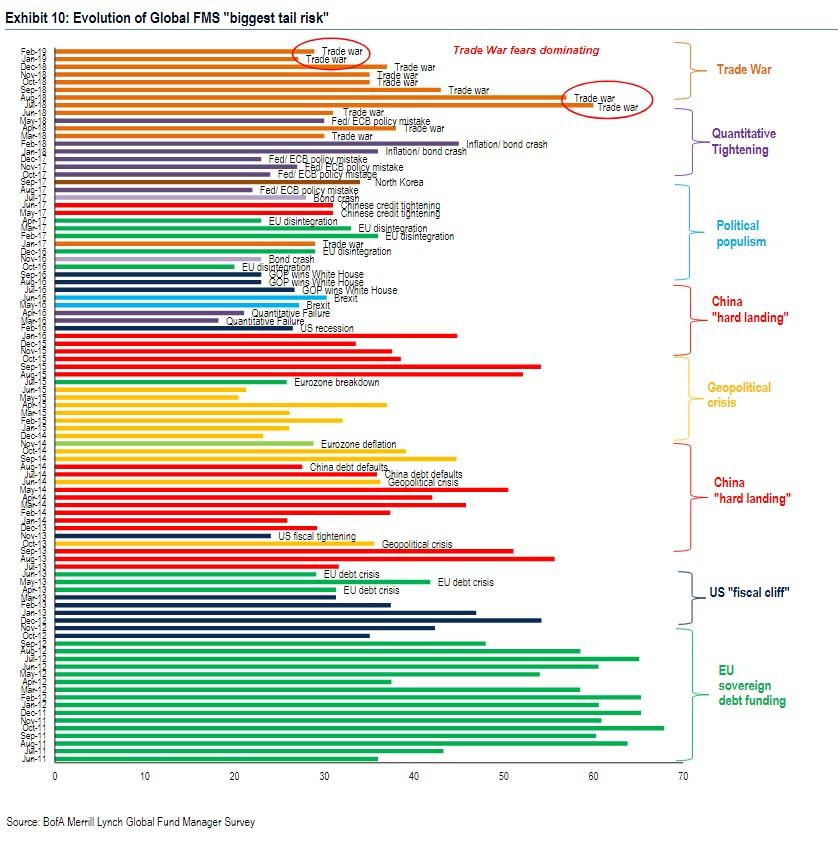
biggest tail risk feb 2019 detail.jpg (650×329)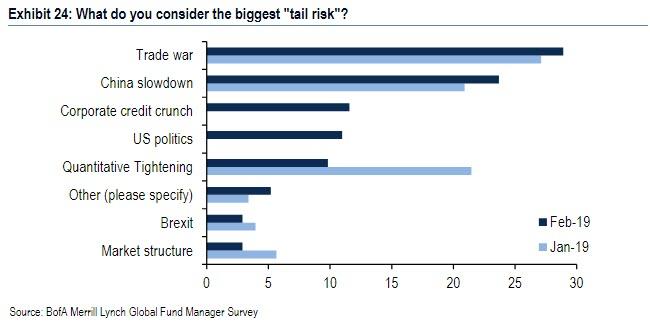
Jeffrey Gundlach on Twitter: "Currently $122 Trillion US unfunded liabilities per Debtclock. That’s 564% of Fiscal ‘18 GDP. To fund would require 10% of GDP for 56+ yrs."
https://twitter.com/TruthGundlach/status/1089693631689121792
▶️ DTube
▶️ IPFS