SWITCH Function in DAX for Excel Power Pivot and Power BI
The SWITCH function in DAX can be used to replace nested IF statement. It is both easier to read and easier to write. SWITCH was introduced in PowerBI in Nov 2016 and it is also available in updated versions of Excel 2016
By the end of this article and examples you will
- Understand the syntax for SWITCH
- Know how you can solve simple a problem using a nested IF statement
- Learn how you can replace a nested IF statement with SWITCH
- Know when to combine SWITCH with TRUE
- Learn how to group data into classification buckets using SWITCH with real case business problem
Understanding the SWITCH syntax
The syntax for SWITCH is:SWITCH ( , , [, , [, … ] ] [, ] )
Where:
Expression: any DAX expression to be evaluated that returns a single scalar value (number, string, or date), where the expression is to be evaluated multiple times (for each row/context).
Value: if the expression has this value the Result will be returned
Result: assuming the Value is returned by the expression, this is the value that will be returned
Else: If the expression does not return the Value, Else is returned.
Both the Value and Results can be repeated, just like creating a nested IF statement.
SWITCH will look for an exact match where the Expression equals the value and will return the result.
Example use of SWITCH expression in DAX
A company provides a benefits package which includes a financial bonus depending on the role of the employee and bonus days paid leave depending on the number of days absent. The criteria for the benefits are laid out in the table below.
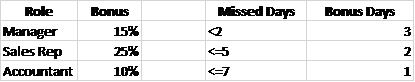
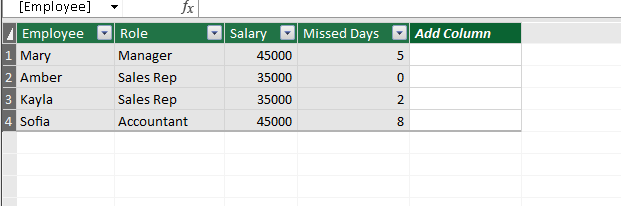
Given the table employee_details, we want to display the % bonus for each employee as a calculated column. We also wish to display the number of bonus days leave each employee will be awarded based on their absentees.
Solving % Bonus with an IF statement
The syntax for an IF statement is
=IF(Logical Test, Value if True, Value if False)
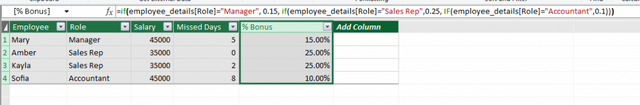
To add the % bonus for each employee based on the employee role we would use the following formula
=IF(employee_details[Role]="Manager", 0.15, IF(employee_details[Role]="Sales Rep", 0.25, IF(employee_details[Role]="Accountant",0.1)))
Where
IF(employee_details[Role]="Manager", would be the first logical test and the Value if True is 0.15
And
IF(employee_details[Role]="Manager", would be the second logical test and the Value if True is 0.25
And
IF(employee_details[Role]="Accountant", would be the third logical test with a Value if True being 0.1
There is no value if false in this example.
Solving % Bonus using SWITCH function in DAX
The syntax for SWITCH is
SWITCH ( , , [, , [, … ] ] [, ] )
In this case our Expression is the column that contains the employee Role. Our first value would be “Manager” and the Value, if it is Manager would be 0.15. Our second Value would be Sales Rep and the Value, if it is Sales Rep, would be 0.25. The third Value would be Accountant and the value given if the employee is an Accountant would be 0.1
=SWITCH(employee_details[Role],"Manager",0.15,"Sales Rep",0.25,"Accountant",0.1)
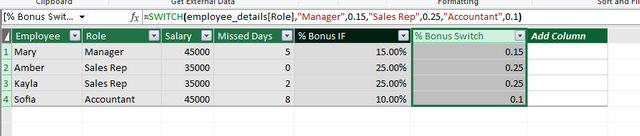
As you can see, the SWITCH expression in DAX is a lot easier to read, and to write, over the nested IF statement.
When to combine SWITCH with TRUE
As SWITCH will look for an exact match where the Expression equals the value and will return the result, we have a problem if we wish to look for a non exact match, such as greater than or less than.
To overcome this we can use TRUE() as the Expression to be evaluated.
Solving bonus days leave with SWITCH
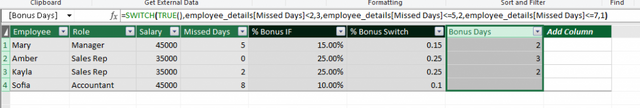
Now that you understand when to combine SWITCH with TRUE we can move forward and add the bonus days leave as a calculated column to our table.
Our SWITCH formula would begin as follows
=SWITCH(TRUE(),
After this we can then enter our logical statement as our value. Our first value would be if the missed days are less than 2
=SWITCH(TRUE(),employee_details[Missed Days]<2
Next this we would enter the result given that the missed days is less than 2, which in this case is 3 bonus days.
=SWITCH(TRUE(),employee_details[Missed Days]<2,3
We can then add our additional logical statements as values. These are the value if the employess missed less than or equal to 5 days and less than or equal to 7 days
=SWITCH(TRUE(),employee_details[Missed Days]<2,3,employee_details[Missed Days]<=5,2,employee_details[Missed Days]<=7,1
Finally, we have the Else. If none of the Values given are met, we can enter and Else value. This can be compared to value if False in an IF statement. As this option is in square brackets [] we have the option to leave it blank.
=SWITCH(TRUE(),employee_details[Missed Days]<2,3,employee_details[Missed Days]<=5,2,employee_details[Missed Days]<=7,1)
It is important to note that the order in which you place the criteria are important. The SWITCH function will evaluate each Value until it finds the first true, at which point it will then stop. Therefore, if we were to write
=SWITCH(TRUE(),employee_details[Missed Days]<=7,1,employee_details[Missed Days]<=5,2,employee_details[Missed Days]<2,3)
On evaluation of the first employee Mary, it will see that the missed days is 5, which is less than or equal to 7 and find that to be true and so return only 1 days bonus. The SWITCH function, as it has found a true on the first test, will not continue to test the other VALUES in the statement. In this case the returned value is not correct.
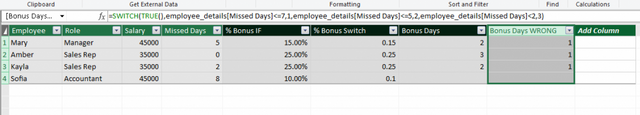
When the calculation moves to the second employee for evaluation, Amber, it will see 0 missed days. This is less than 7 and therefore will return only 1 bonus day. The SWITCH expression, as it has found a true on the first test, will not continue to test the other VALUES in the statement. In this case the returned value is not correct.
As you can see, it is important to think logically when writing a SWITCH expression combined with TRUE() to ensure you get the results you expect. If you place the values in the wrong order, you will get the wrong results.
Learn and Earn Activity – Advanced DAX SWITCH for you to practice
This activity will give you the skills to use SWITCH to classify data into different buckets. This is your chance to earn some STEEM tokens while you learn.
We have been given the following table of data which includes all outstanding invoices on a ledger.
| Customer | Invoice Number | Invoice Date | Report Date | Invoice Value |
| Small Shop Ltd | 2001 | 18/12/2018 | 20-Mar | 8663 |
| Large Shop Ltd | 2005 | 20/12/2018 | 20-Mar | 7841 |
| Small Shop Ltd | 2010 | 21/12/2018 | 20-Mar | 9341 |
| Large Shop Ltd | 2015 | 29/12/2018 | 20-Mar | 11254 |
| Corner Shop Ltd | 2018 | 15/01/2019 | 20-Mar | 6517 |
| Supermarket Ltd | 2019 | 15/01/2019 | 20-Mar | 14674 |
| Corner Shop Ltd | 2050 | 16/01/2019 | 20-Mar | 11294 |
| Supermarket Ltd | 2061 | 17/01/2019 | 20-Mar | 4586 |
| Small Shop Ltd | 2076 | 17/01/2019 | 20-Mar | 14223 |
| Large Shop Ltd | 2079 | 18/01/2019 | 20-Mar | 3794 |
| Corner Shop Ltd | 2085 | 22/01/2019 | 20-Mar | 4408 |
| Supermarket Ltd | 2086 | 23/01/2019 | 20-Mar | 9615 |
| Small Shop Ltd | 2105 | 16/02/2019 | 20-Mar | 4795 |
| Large Shop Ltd | 2108 | 17/02/2019 | 20-Mar | 13047 |
| Corner Shop Ltd | 2180 | 17/02/2019 | 20-Mar | 12899 |
| Supermarket Ltd | 2190 | 18/02/2019 | 20-Mar | 12990 |
| Small Shop Ltd | 2201 | 22/02/2019 | 20-Mar | 12126 |
| Large Shop Ltd | 2204 | 23/02/2019 | 20-Mar | 4587 |
| Corner Shop Ltd | 2222 | 07/03/2019 | 20-Mar | 4231 |
| Supermarket Ltd | 2235 | 10/03/2019 | 20-Mar | 10398 |
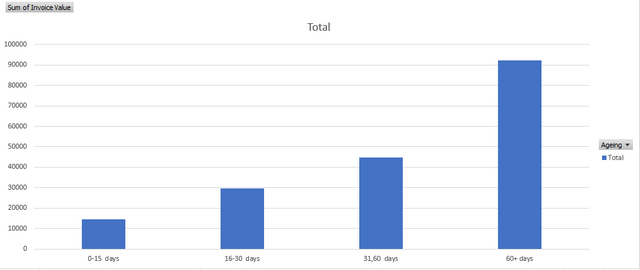
0-15 days old
16-30 days old
31-60 days old
61+ days old
You can select any visualization you deem appropriate to best display the data. This is the chart we prepared in Excel
To earn STEEM rewards on this post, in the comment section below, answer the following questions
- What is the DAX expression you used to classify the age of the invoice?
- Why did you create a calculated column over a measure?
- Share a copy of the visualization you created
Tip: DATEDIFF expression in DAX
The DAX expression DATEDIFF can be used in this example. DATEDIFF will get the difference between 2 dates (assuming the data type DATE or DATE/TIME or TIME) expressed as the selected interval. The interval can be Day, Month, Quarter, Week, year, or it could be Hour, Minute or SecondThe syntax for DATEDIFF is
=DATEDIFF(Date 1, Date 2, Interval)
For Example, we wish to calculate the number of days between two dates as per the table below

We would use the expression
=DATEDIFF(invoiceage[First Date],invoiceage[Second Date],DAY)

Next week I will provide a video solution to the earn and learn activity, so get practicing and posts your solutions so you can earn while you learn.L

Now there is value in Learning with The Excel Club and our Learn and Earn STEEM activities.
We are the first Excel, PowerBI and DAX blog in the world where you can Earn while you Learn.
Find out more now and start earning while you are learning Excel and Power BI
Earn and Learn Solution
The video below shows the solution to the above activity. The activity is still open for rewards. If you have not yet given the activity a try, now is your change to earn while you learn. Posts your solutions in the comments below.
Sign up for my newsletter – Don’t worry, I wont spam. Just useful Excel and Power BI tips and tricks to your inbox
SIGN UP
Posted from my blog with SteemPress : http://theexcelclub.com/switch-function-in-dax-for-excel-power-pivot-and-power-bi/
hay paula - is there a SWITCH Function for standard Excel?
I didnt do the activity in full as I have not yet brushed up on my Excel Power Pivot Skills but I do know the answer to
Why did you create a calculated column over a measure?
A calculated column can be used as a field in a pivot table. A measure can not. If you did this as a measure, you would have to add it as a value to a field and would not be able to create the visulisation you made
Hi @dernan, yes there is a switch function in Excel. I havent yet covered it as a learning blog.
as for the calculated column - you are correct, columns can be used as fields in pivot tables and visulisations whereas measures can not