EOS Price Analysis: 50-Day MA Remains Strong Defensive Line for EOS
 EOS/USD Long-term Trend: Bullish
Key resistance levels: $4.3, $5, $6
Key support levels: $3, $2, $1.5
On a long-term outlook, EOS EOS, 13.16% appeared to be in a bearish trend following the significant drop in May of 2018. The important 50-days moving average (yellow line) revealed the long-slope above the price action after a cross up in June 2018. The yearly trade closed at a major loss ($21 - $2.5).
Last month, EOS saw a rise to $4.3 above the 50-days MA line and has since been waving on it - a significant bullish signal. The positive move is revealed on the daily MACD. Currently, bears are taking aim at the $3 support, which sits on the yellow line.
As the daily Stochastic RSI lies at the lowest level, an upward movement is likely to see $4.3, $5 and $6 respectively. At the same time, a dump might reposition EOS in a bearish condition. For now, the bulls are holding positions tightly as the yellow line remains a strong defensive line. 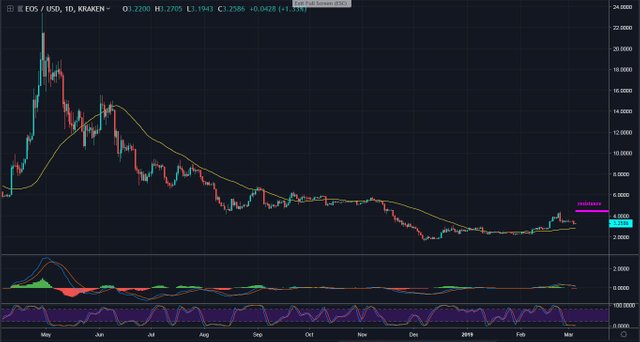 EOS/USD Medium-term Trend: Bullish
Surpassing Litecoin and taking over its 4th position last month, EOS witnessed a surge to $4.3 before declining to the bottom of the trend line, and has been consolidating since. The 4-hour MACD oscillator has already switched to the negative level.
Yesterday, EOS saw another sell-off from $3.5, breaking down the existing trend line to $3.1, confirming the existing bearish move. The MACD still plays along lower. The next drop is expected at the $3 tough support level. In case a further break-down occurs at this support level, the value of the token could depreciate heavily. 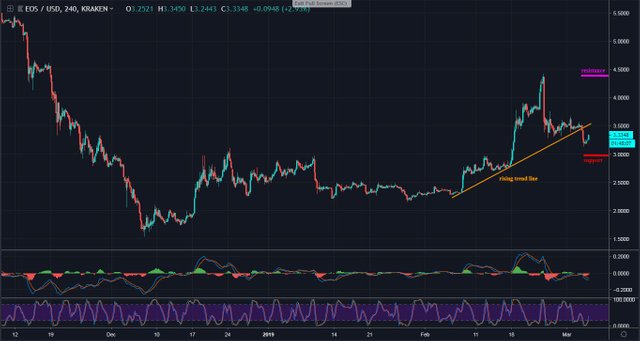 EOS/USD Short-term Trend: Bearish
After the massive drop in late February which broke down the diagonal support, EOS flagged in a symmetrical triangle pattern for over a week before a bearish scenario played out. This is also reflected in the hourly MACD.
Reaching the angle of the symmetrical triangle yesterday, EOS broke down to a low of $3.1 before a retracement. At the moment, a swing high is nearing the $3.4 resistance level, where the lower trend line lies. In fact, the hourly Stochastic RSI has reached its highest (overbought zone) condition. A downward drive at the 80 line might bounce the token lower.
For the bear side, the next possible targets are $3, $2.8 and $2.6 support levels. For the bull sides, the key resistance levels are $3.4, $3.6 and $3.8. But as it appears, an uptrend is yet to be signaled. For now, the market remains in a bearish condition. 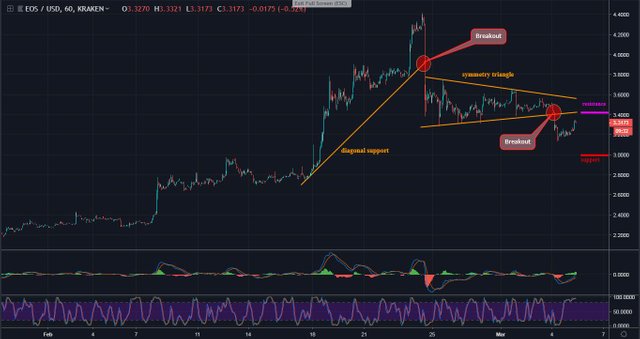 CADASTRO https://www.binance.com/?ref=12067061