NZD/USD Post-RBNZ Long Trade Walkthrough
NZD/USD Key Points
- Higher time frame, NZD/USD support holds meaning we look for longs.
- Intraday stepping pattern forms as previous short term resistance is retested as support for entries.
- Allows us to add into winning positions and hit potential home run trades.
NZD/USD Technical Analysis
Morning team,
Yesterday's daily market analysis went over the RBNZ sending shockwaves through NZD/USD by slashing interest rates by 50 bps.
I went over both the fundamentals and technicals, unexpectedly ending the piece by saying that I'm short term bullish thanks to the daily close.
If you missed it, here's an extract below, or simply click the link in the first paragraph to read the full peice of NZD/USD analysis.
With price above higher time frame support like this, I'm more inclined to look for longs than shorts. Something I can't believe I'm saying, but that's what the technicals are telling me.
We now wait for an intraday retest of short term resistance turned support as confirmation.
It does sound crazy though, doesn't it...
Talking about being bullish Kiwi, even short term bullish, after the Reserve Bank of New Zealand slashed rates not by just 25 bps, but a double barrelled cut of 50 bps.
But as the famous saying goes, markets can remain irrational longer than you can remain solvent and here we are.
So let me justify my thoughts at the time and then go over yesterday's, intraday NZD/USD price action.
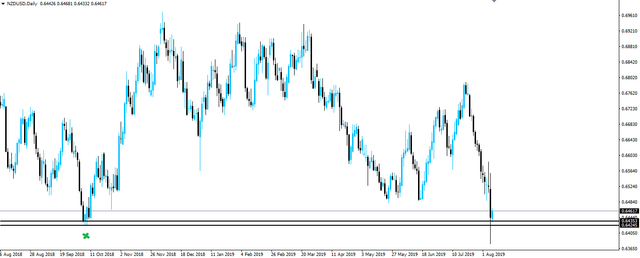
You can see on the daily chart in the quotes above, that price respected the obvious higher time frame support on the daily. Price did go through the zone, but it was quickly bought up and closed above.
Bullish af.
Being above higher time frame support and not wanting to fight the higher time frame flow, I therefore turned bullish for the next trading day.
Now zoom into the 15 minute, NZD/USD chart and lets take a look at the intraday price action that followed:
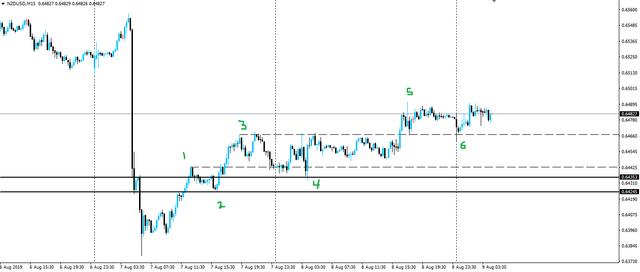
I've included the MT4 period separators which indicate the daily candle closes and numbered the chart so you can easily see what I'm referring to.
So after the RBNZ decision, you can see that price ripped through the higher time frame support zone and was quickly bought back above to 1.
Price then retestesd the support zone, reactivating it as support at 2. Price then made a new intraday high at 3 and retested previous short term resistance as support at 4.
This was an example of an intraday retest that I talk about using as an entry. Remember, only because it was in the direction that the higher time frame chart was telling us to trade.
Price then made a new intraday high at 5 and retested previous short term resistance as support once again at 6.
This second retest allows to you add into your original position. Stops can be averaged together to minimise risk, or you can treat them as separate positions entirely.
It's all about building size in your winning positions. The key to trading is cutting your losers short and adding into winners to make them proper home runs.
This NZD/USD setup was a good example of how you can go about doing that.
Best of probabilities to you.
Dane.
Fallout From Economic Releases
NZD Official Cash Rate
NZD RBNZ Monetary Policy Statement
NZD RBNZ Rate Statement
NZD RBNZ Press Conference
@forexbrokr | Steemit Blog
Market Analyst and Forex Broker.
Join my Inner Circle ⭕️ - www.forexbrokr.com
Should bounce, which is the pull back, I'm looking for an entry to go short a bit higher, but can't find one at the moment.
Yeah, I like that strategy. Now just to wait until price action starts to show weakness.
Posted using Partiko iOS