Weekly Market Preview: Forex and Cryptocurrency Market Monday

Hey guys,
Hope you enjoyed your weekend, but as always, all good things must come to an end. It’s time to start the week off with a bang and get back to work.
I’ve spent the afternoon going through my forex and crypto chart watchlist on TradingView, doing my levels on each timeframe and ready to dump them here.
So without anymore small talk, let’s get straight into the chart dump, shall we?
Hehehe dump.
💩.
Forex Markets
It’s been two weeks since I last featured forex markets in my weekly market preview blogs, so it’s definitely time to do another.
I only trade the majors, so they’re the only charts that I’m going to go through here. Of course starting with a higher time frame look at EUR/USD:
EUR/USD Weekly
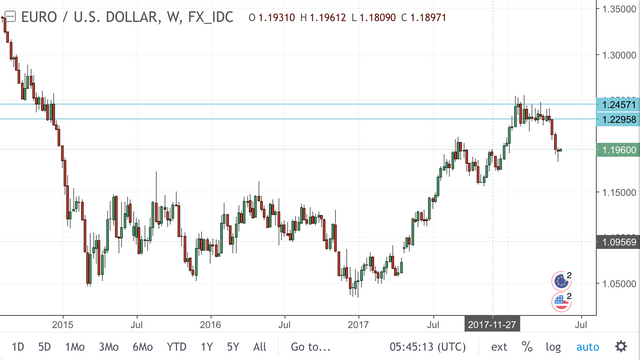
You can see I’d rather be playing from the short side as that weekly zone has obviously held and price rejected down hard.
So with that in mind, take a step in to where it starts to get interesting:
EUR/USD Daily
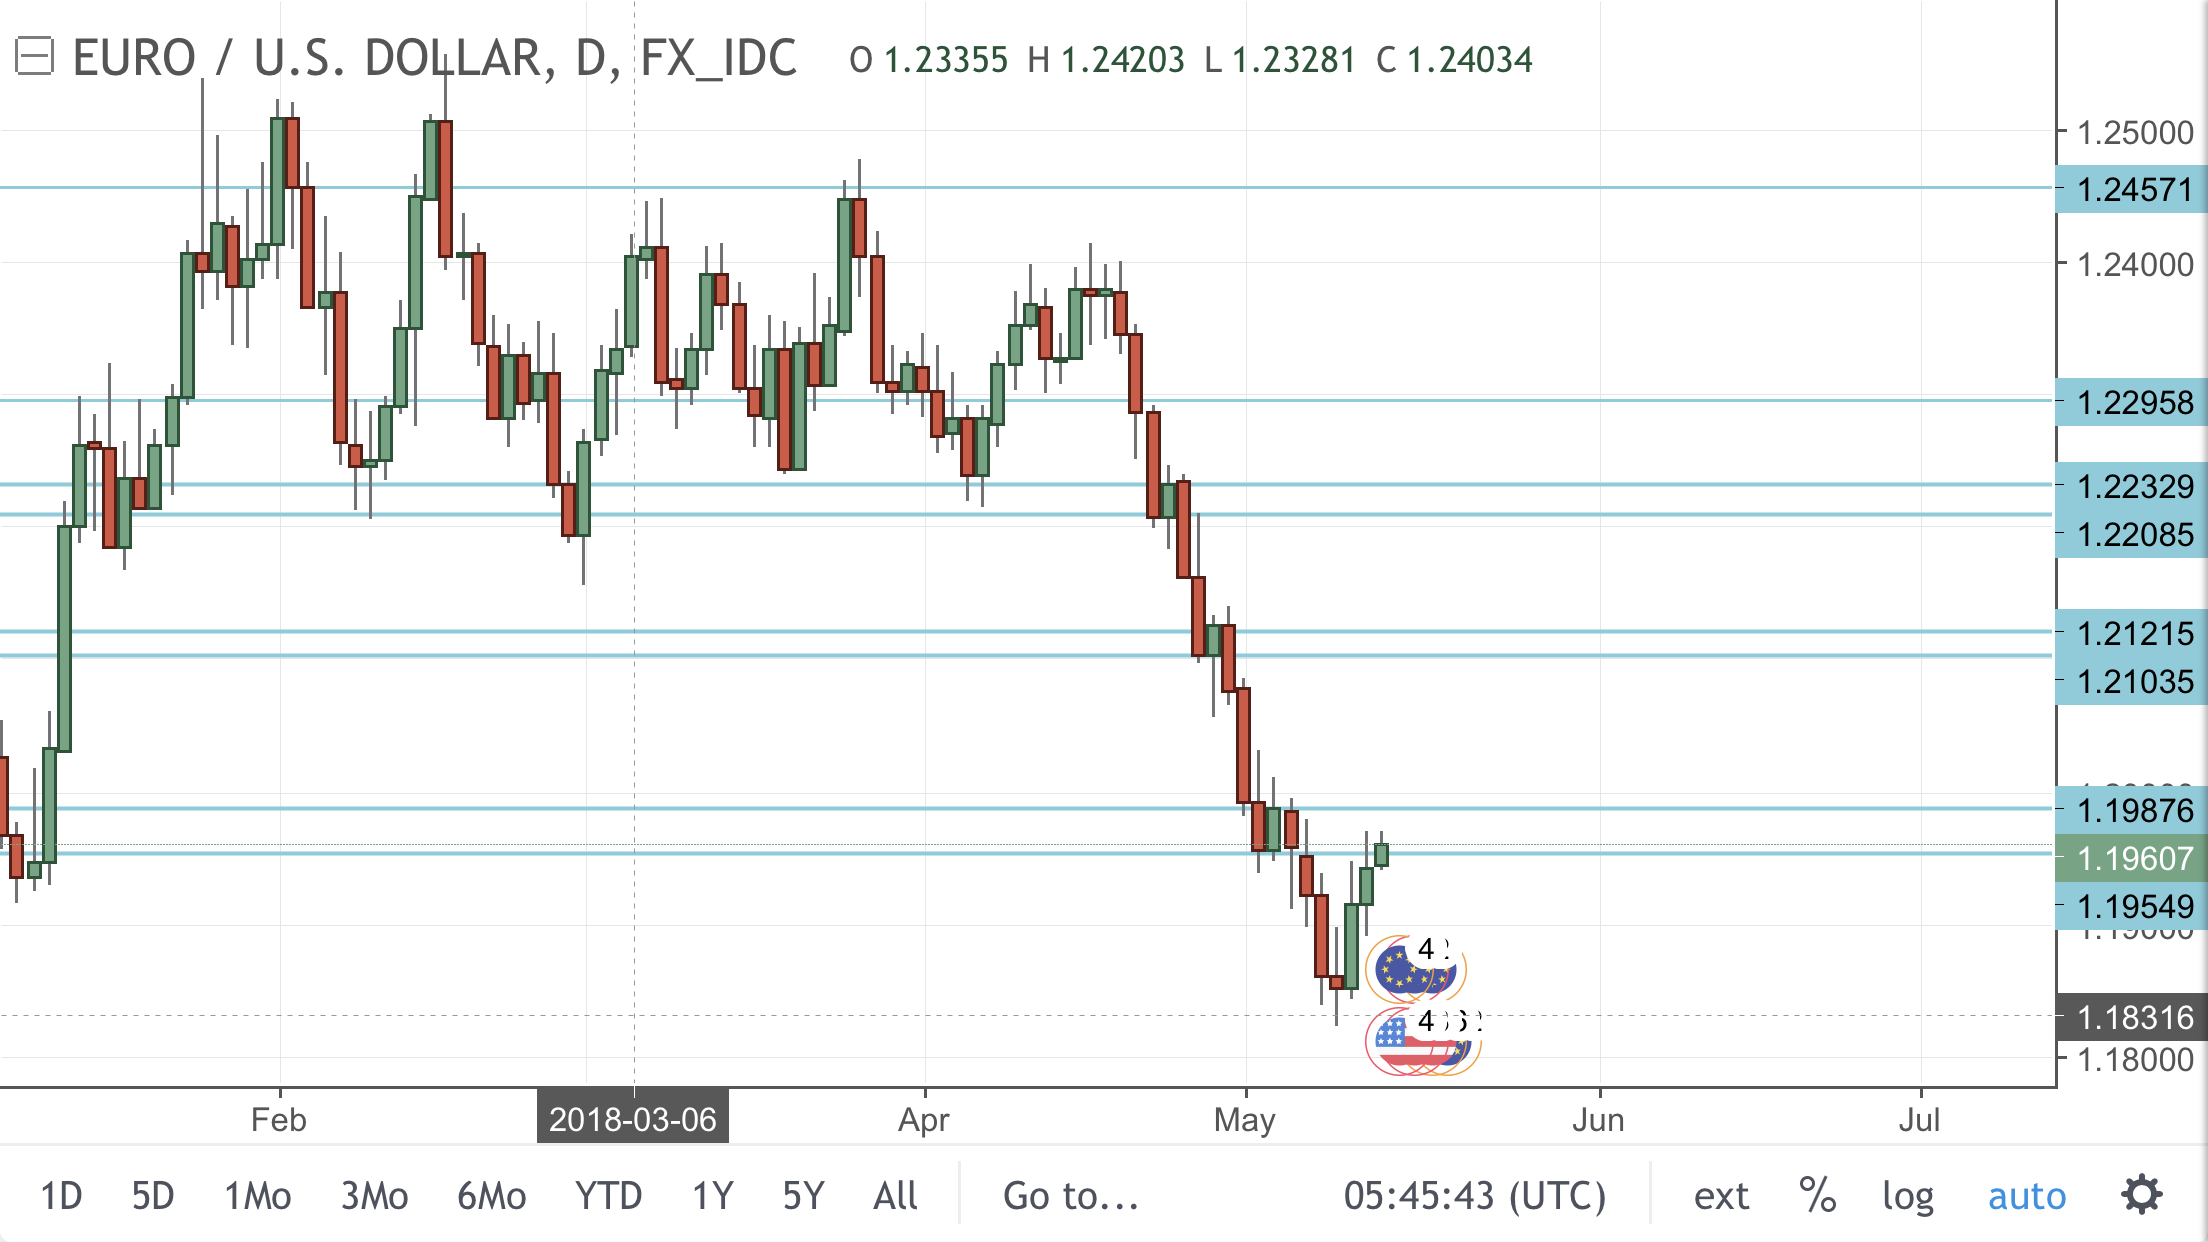
Now I’m not saying that they will, but after weekly resistance held, these are the pullback zones to short IF they hold.
I of course will be watching the hourly on any intraday view blogs that I do through the week.
Moving onto GBP/USD and although I’ve closed my Cable shorts, the market is in an interesting spot on the higher time frame:
GBP/USD Weekly
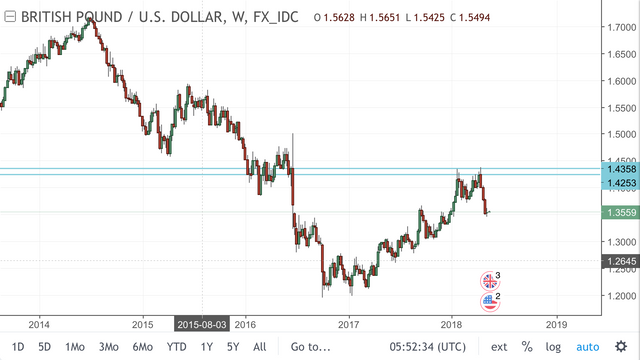
I spoke about closing my shorts because price dropped into that weekly zone. A zone that you can see much more clearly on the daily:
GBP/USD Daily
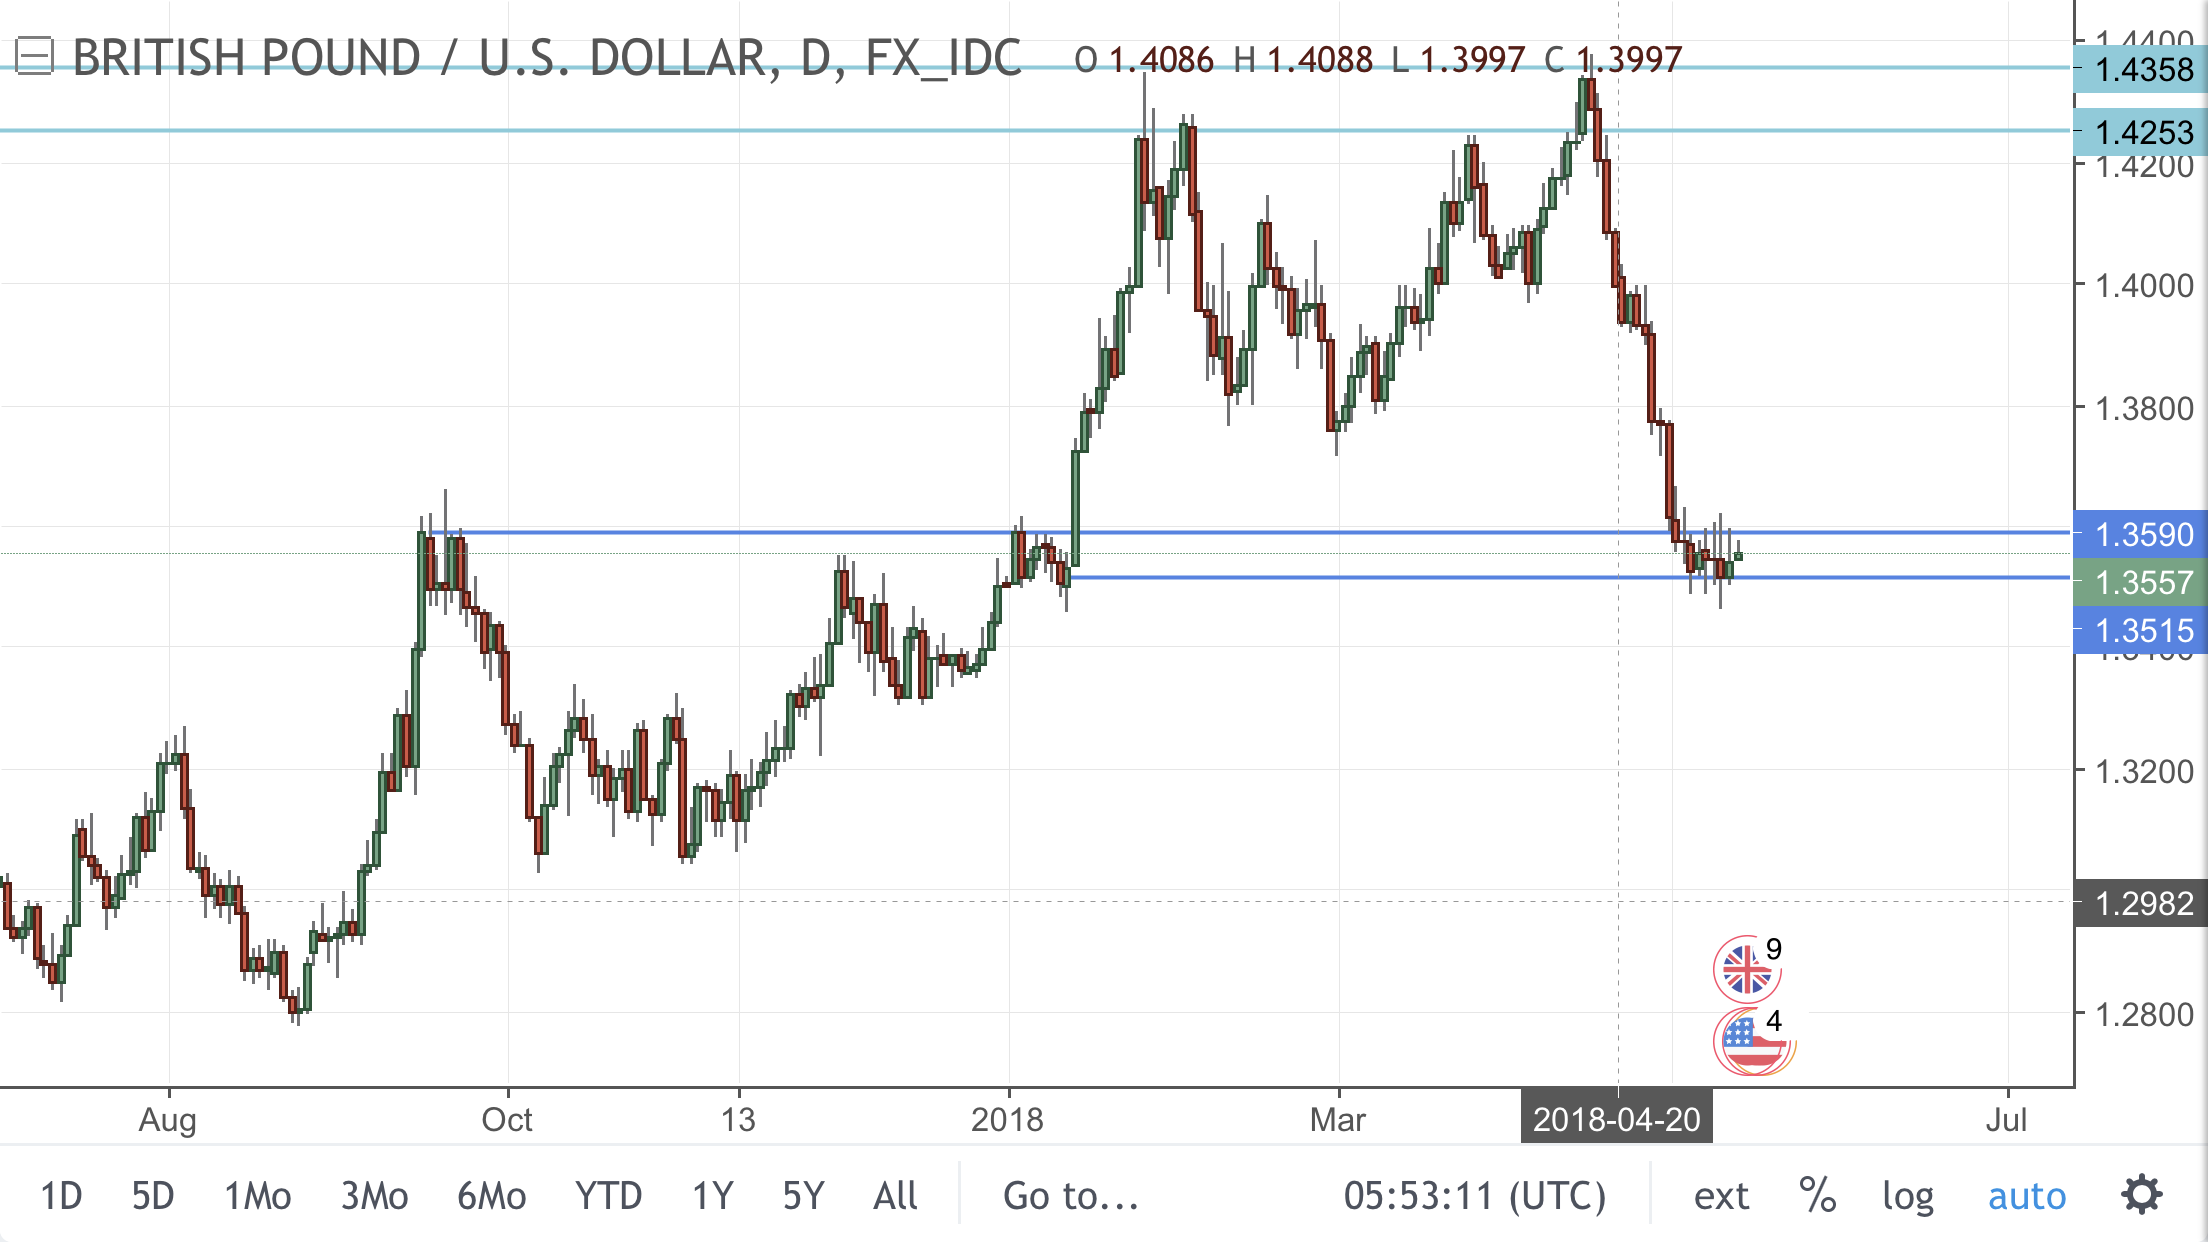
So you can see that the level is giving price a reason to pause, but it’s inability to get a decent rip out of it is showing weakness to me.
Regardless, I’m happy to be out and see better opportunity elsewhere.
Elsewhere such as on AUD/USD. Take a look at the higher time frame level that has already seen Aussie shorts in play:
AUD/USD Weekly
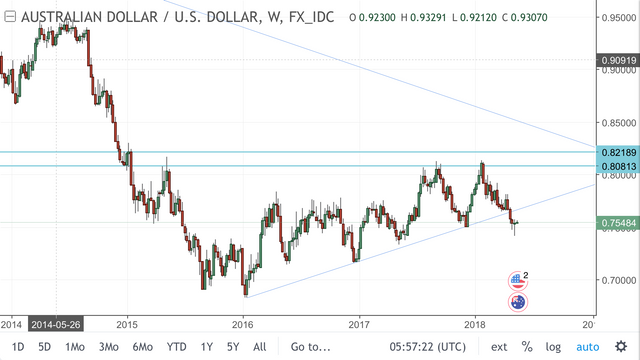
So price rejected off the weekly zone, broke through trend line support and has now pulled back on the daily:
AUD/USD Daily
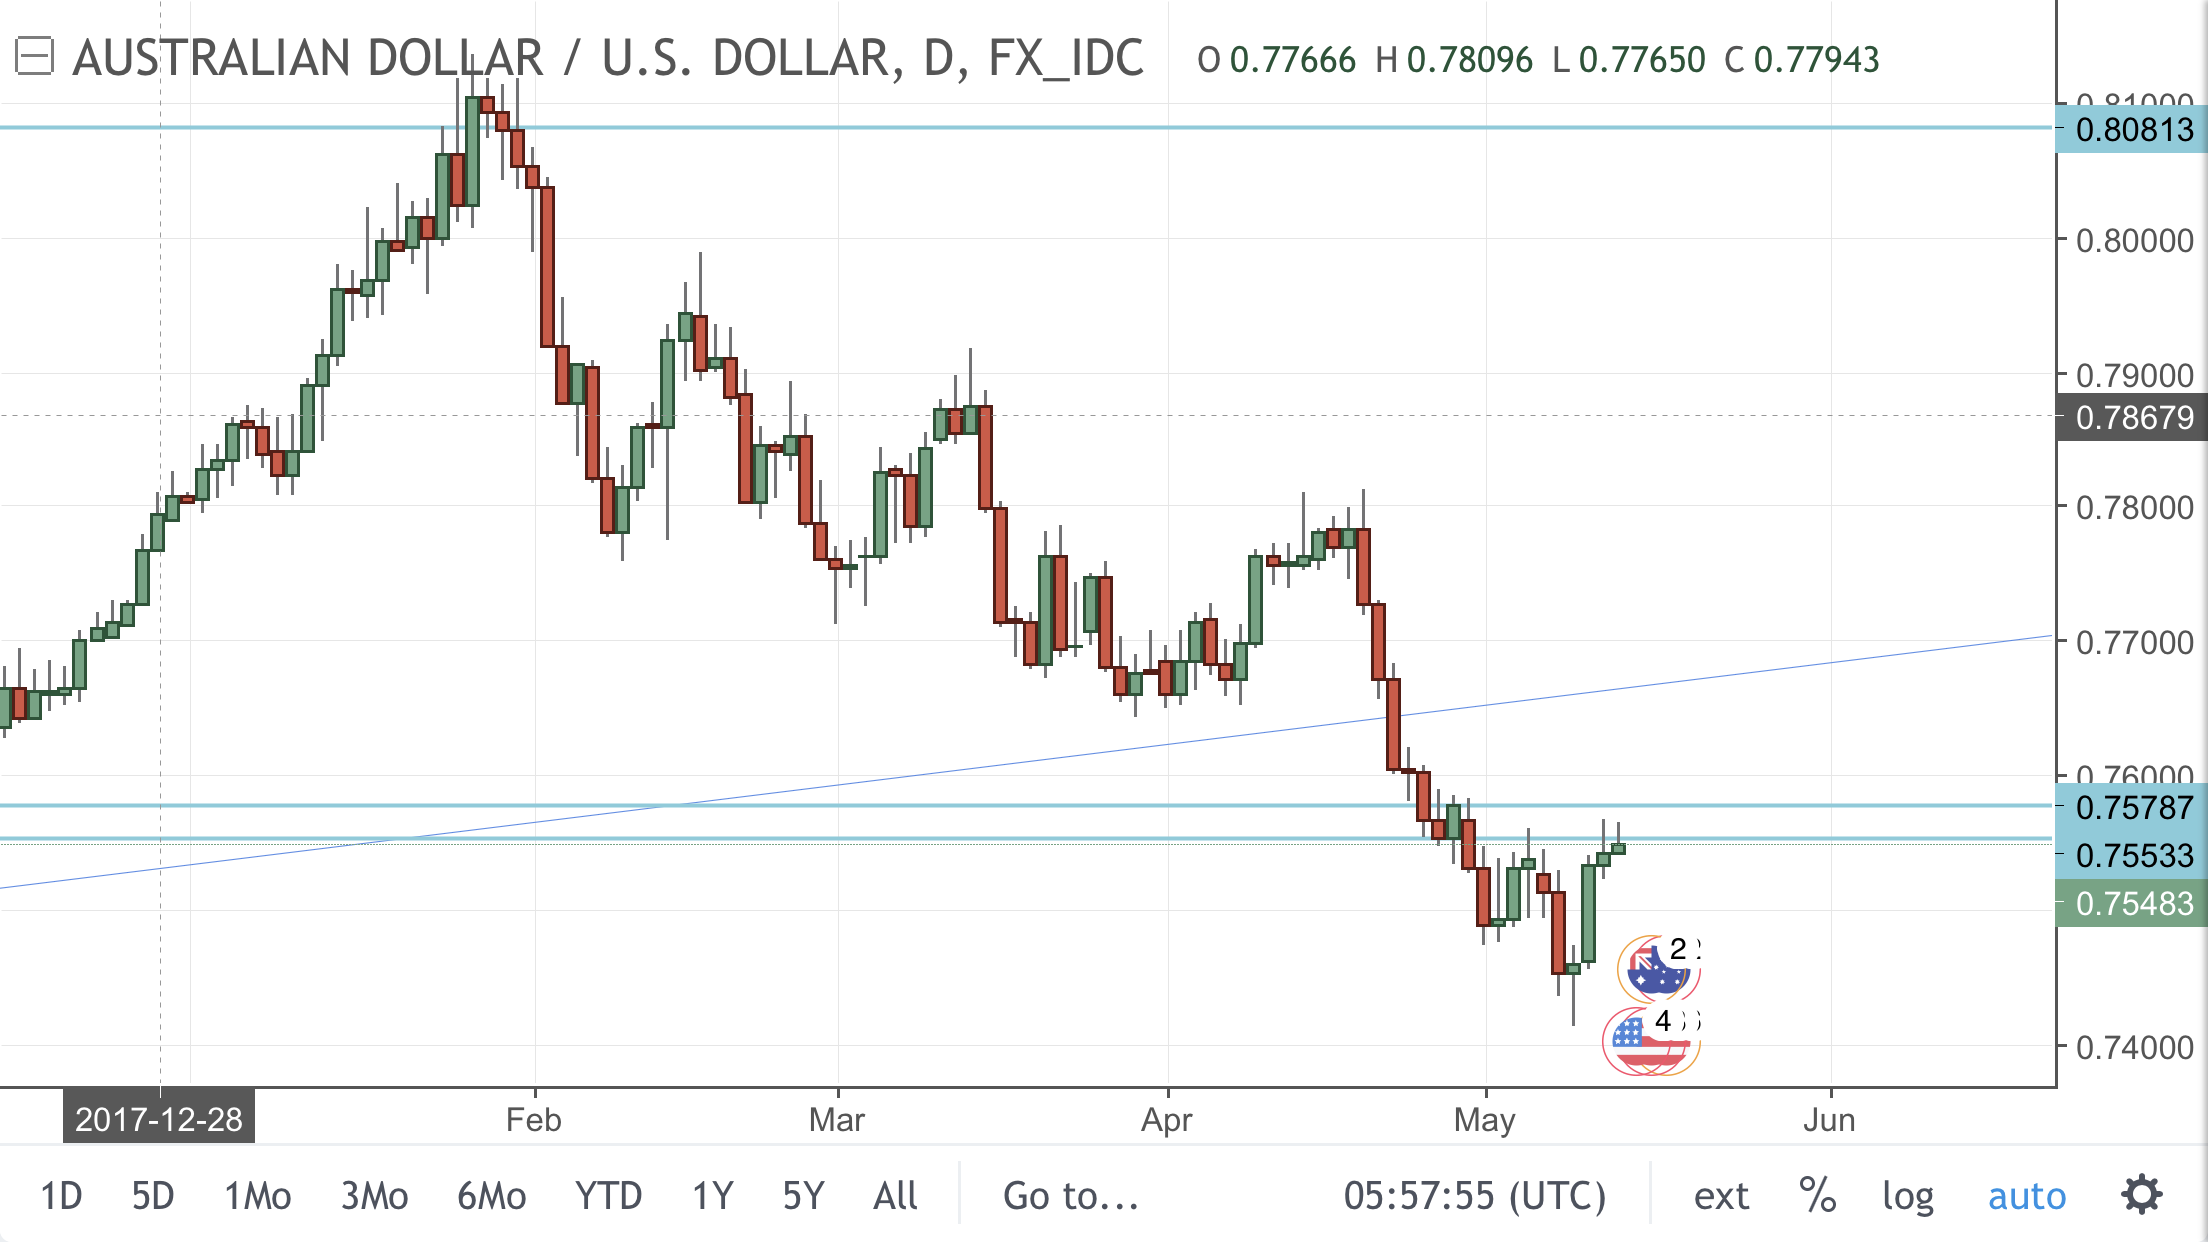
This is the level that I’ve already been shorting and either you’ve taken profit multiple times or you’ve been given multiple chances to get short if you missed the previous chance.
Here’s an intraday chart to really highlight this fact:
AUD/USD Hourly
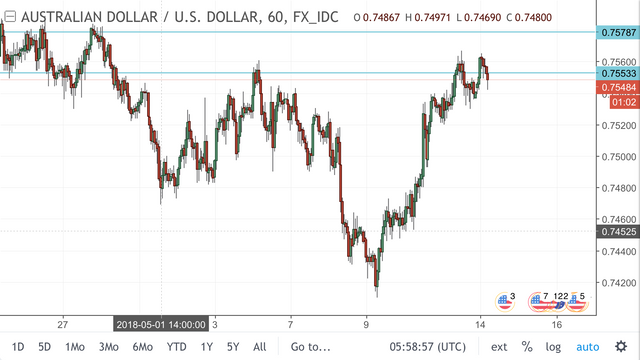
Just be patient in your trading. Contrary to popular belief, the market hardly ever rips and runs away without you.
Last in my forex majors chart dump, comes the backward one. Good old, USD/JPY:
USD/JPY Weekly
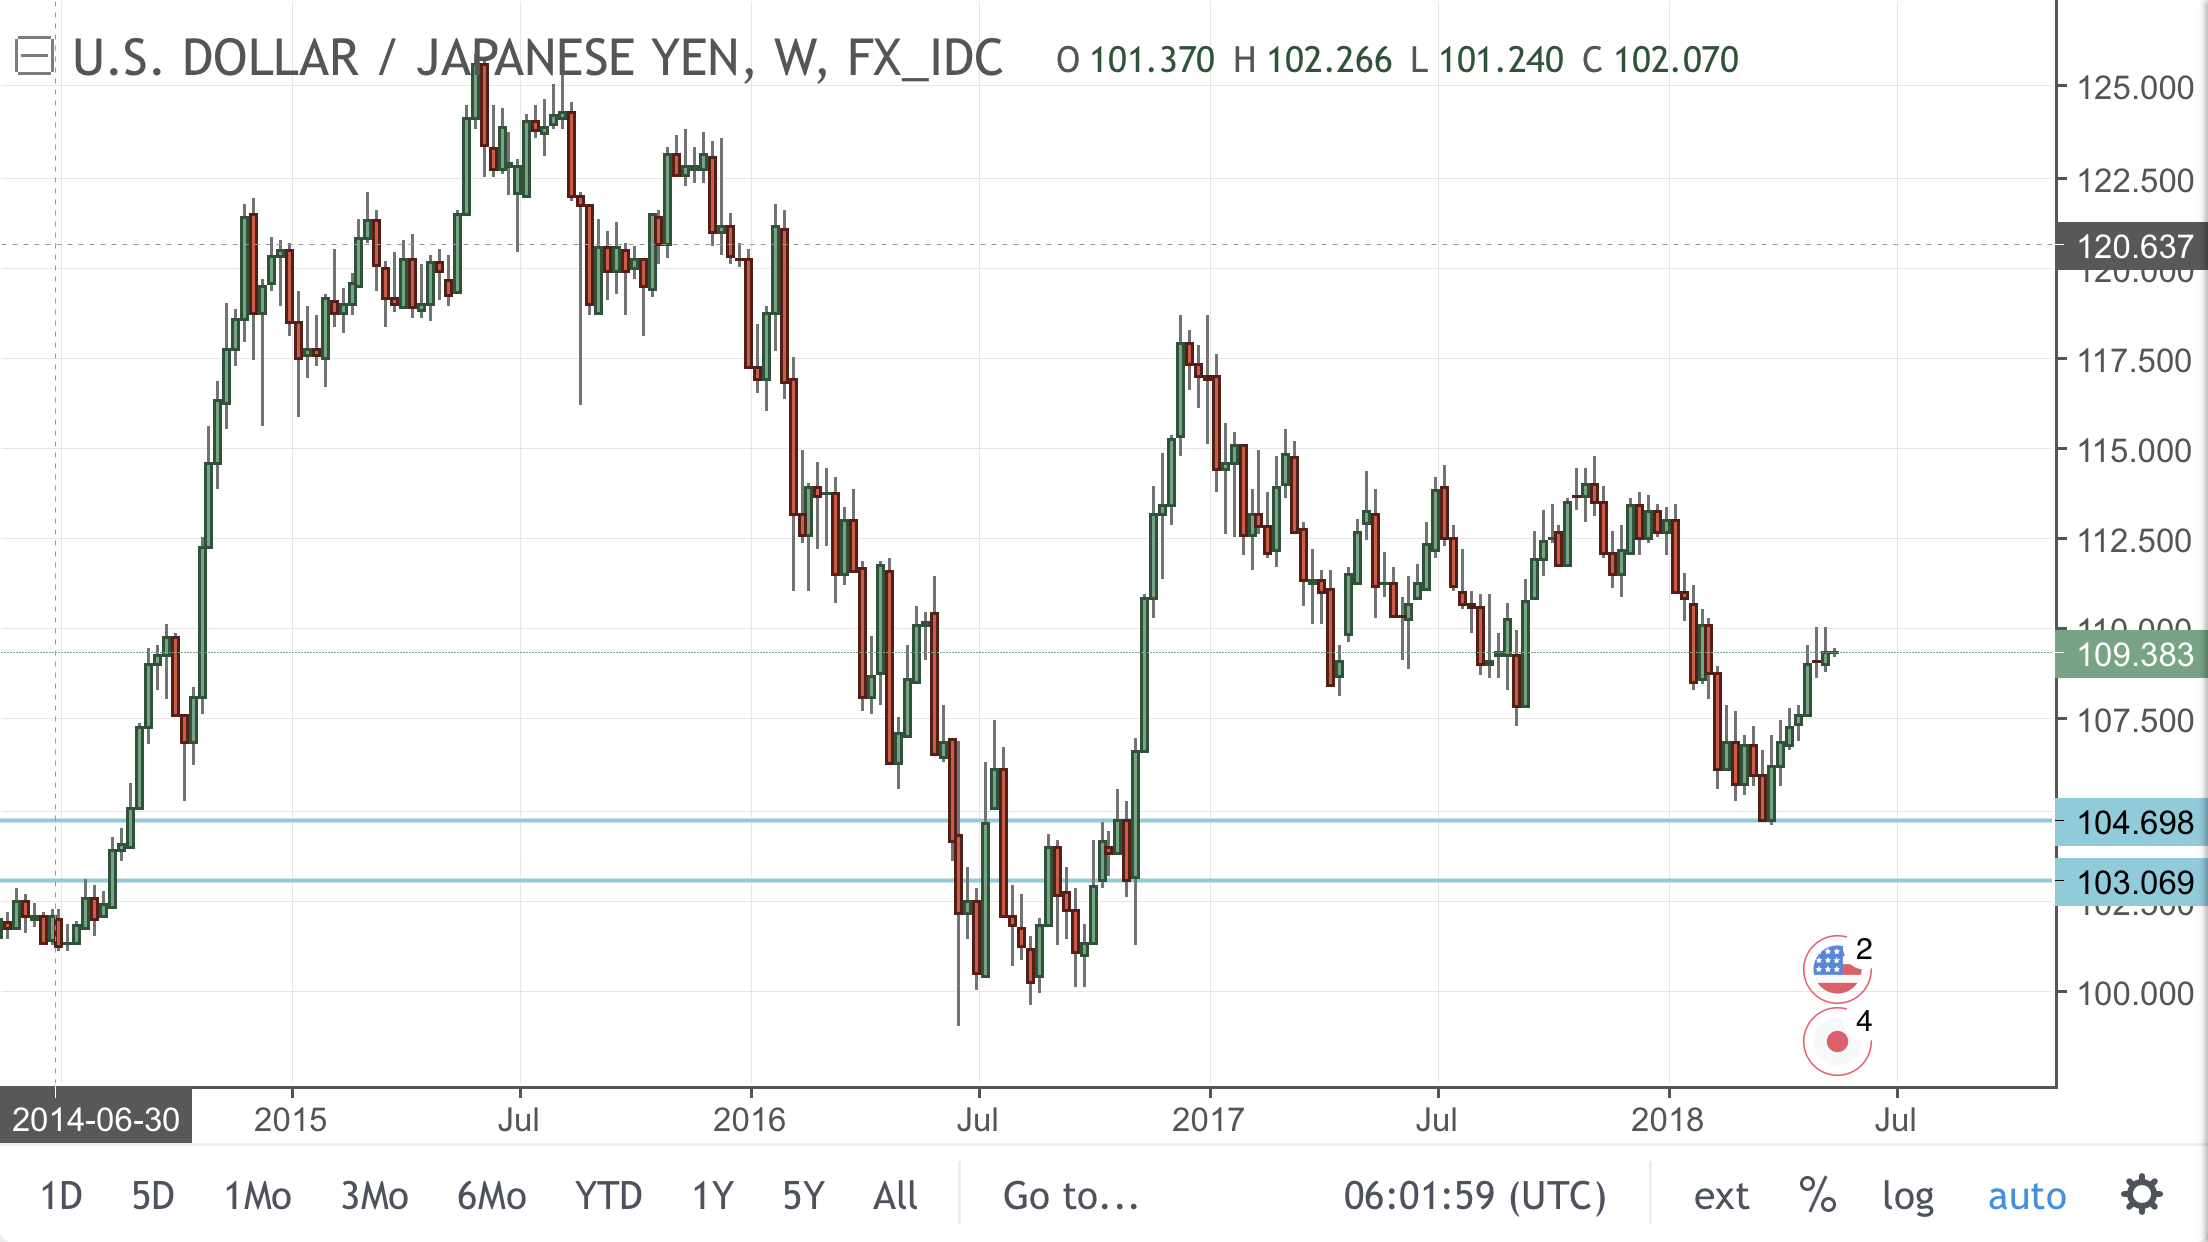
With USD strength, this pair has of course inversely to the rest of the majors above, held higher time frame support.
Take another step in to the daily chart and you can see that price hasn’t really stepped up cleanly:
USD/JPY Daily
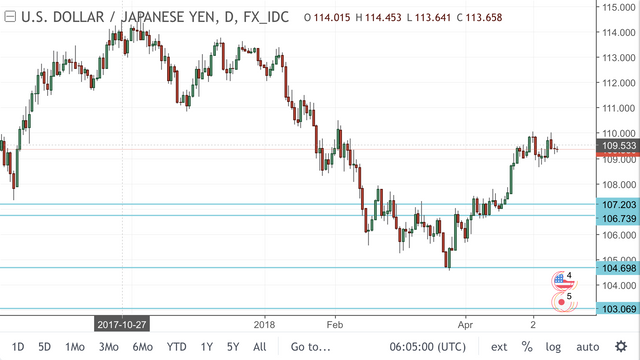
But there is one pullback level on the radar and I’m now in a waiting phase for any pullbacks that might come our way.
Cryptocurrency Markets
It hasn’t been as long since I featured cryptocurrency markets in a weekly preview blog, but there are some quality levels that aren’t worth redoing.
Starting as always with a higher time frame look at Bitcoin:
BTC/USD Daily
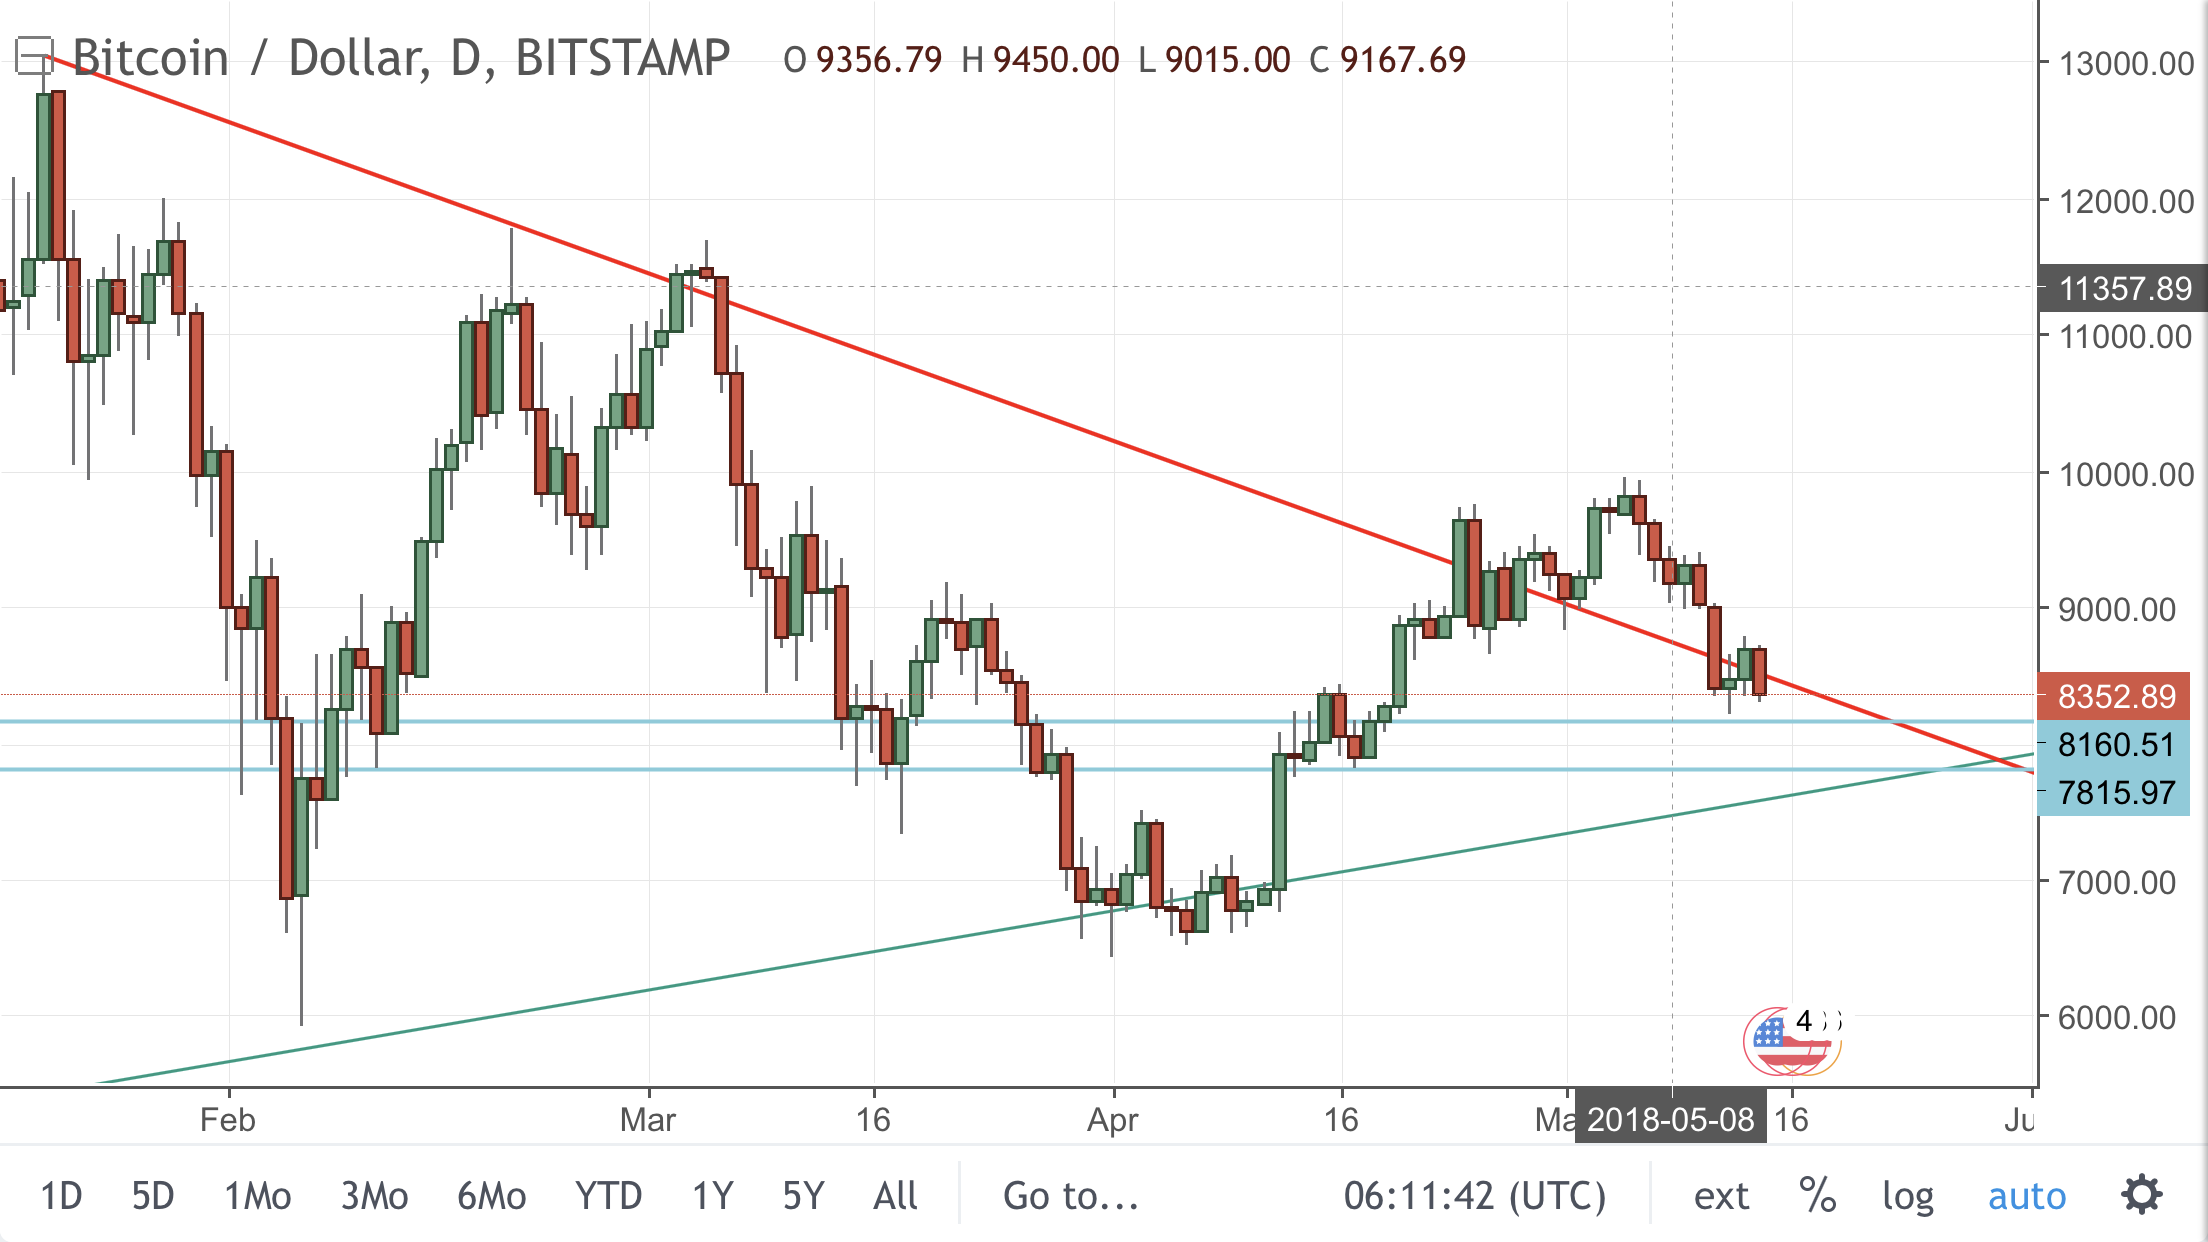
I’ve spoken about taking a Bitcoin long trade this weekend already, with price not quite hitting, but as good as hitting, that weekly support zone.
I then, as always, zoom into an intraday chart and look for pullbacks into previous short term resistance turned support:
BTC/USD Hourly
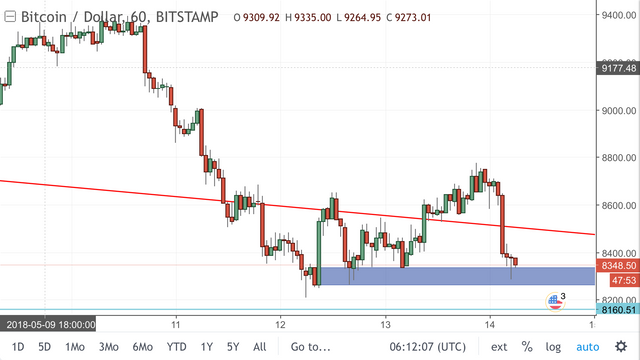
As I said in a comment today, this Bitcoin level is in play until it breaks. Which it doesn’t look like doing.
Go you good thing!
Next up, I usually feature EOS in place of Ethereum because... well you know, because Ethereum is shit.
But unfortunately, the higher time frame chart doesn’t look too exciting:
EOS/USD Daily
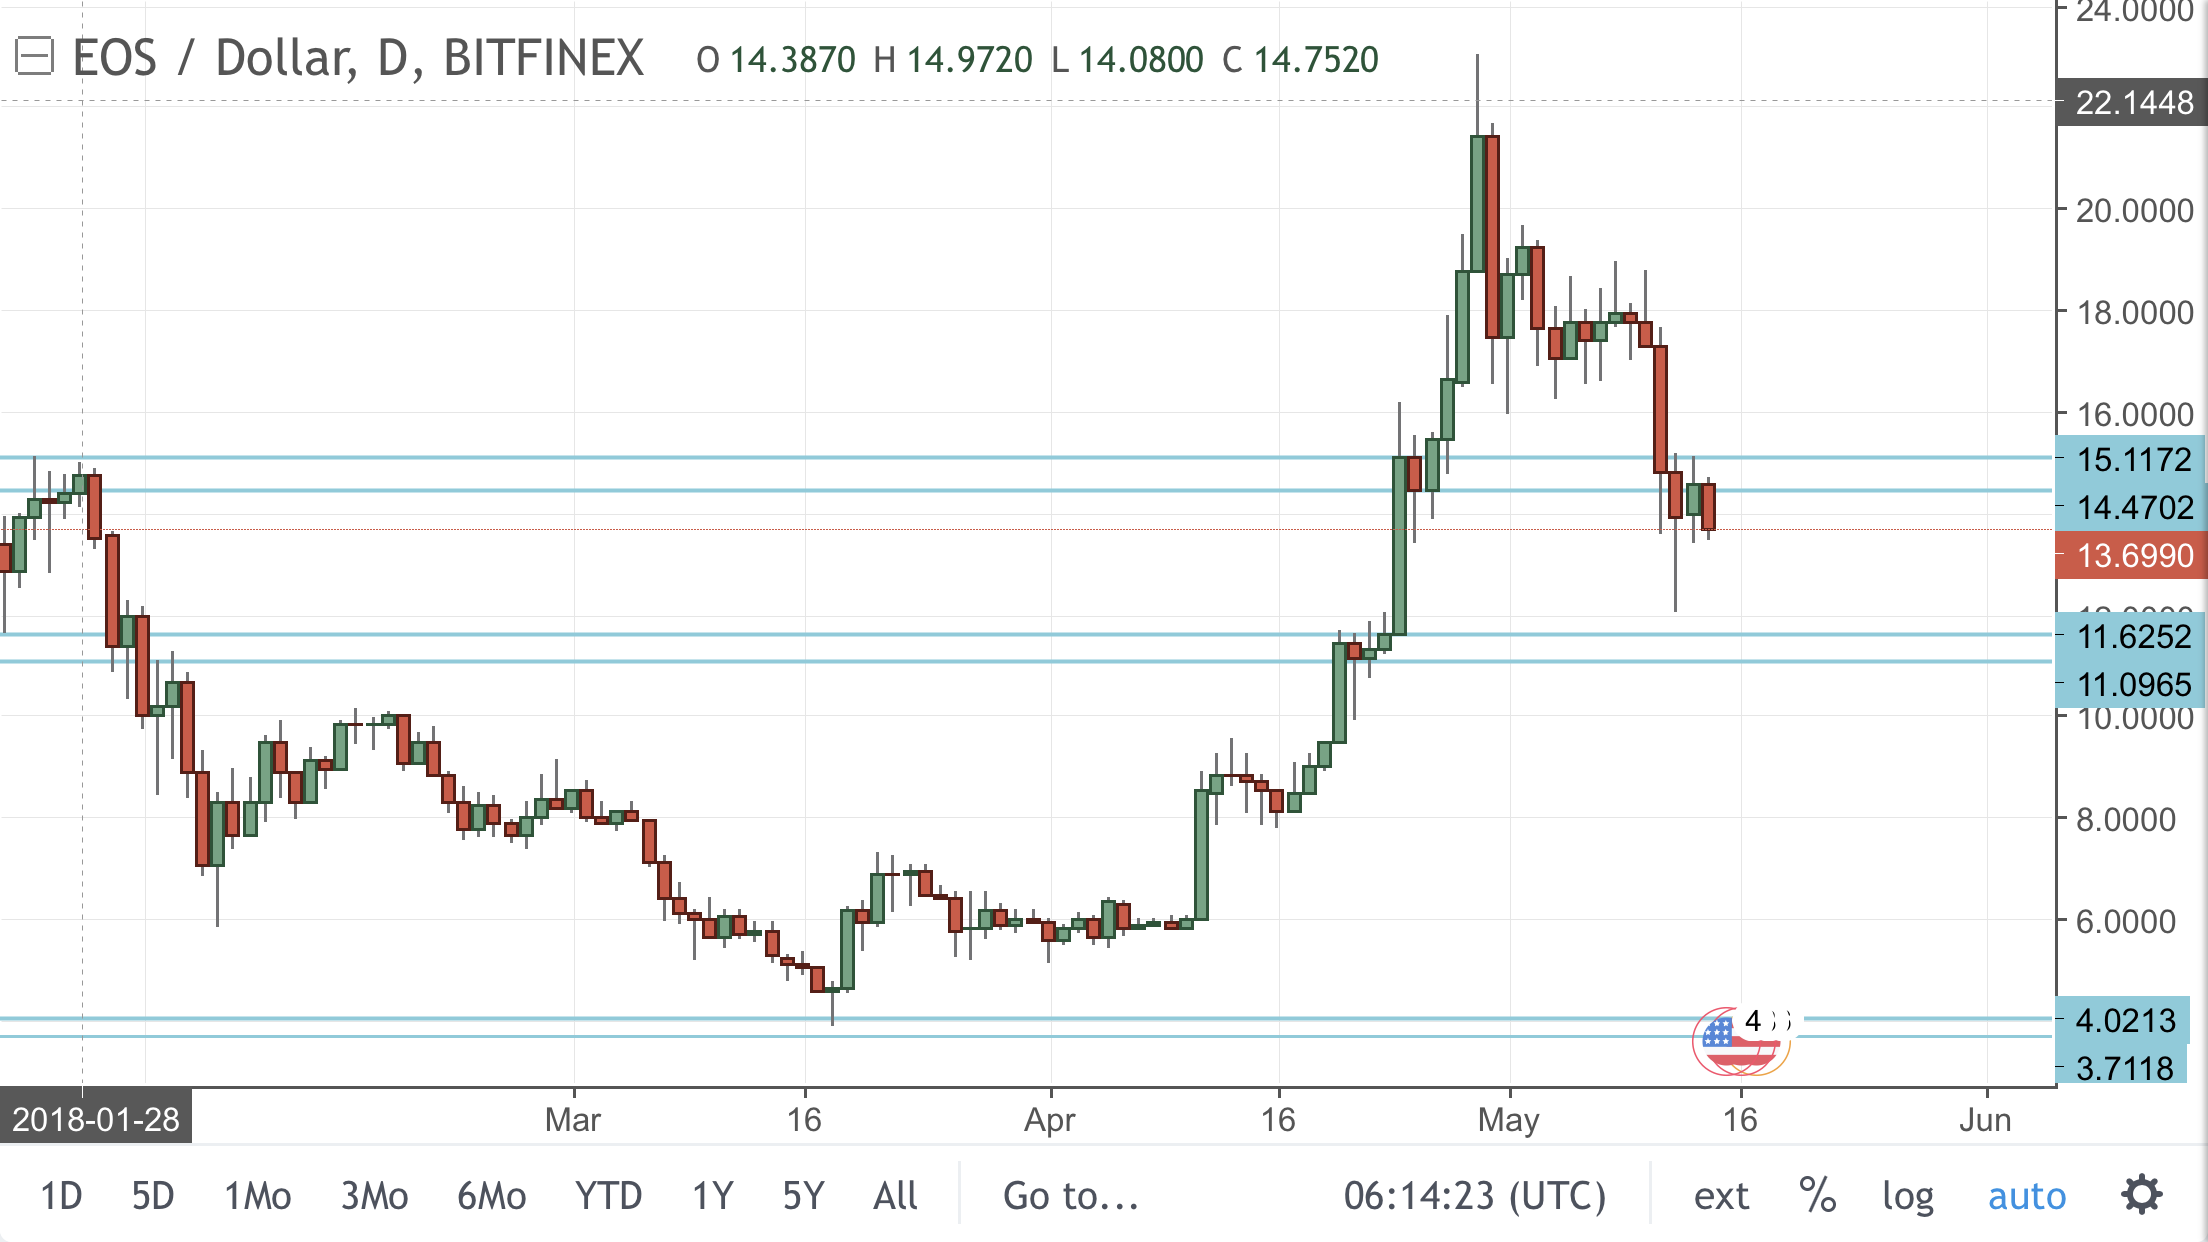
I’m not in the game of shorting crypto, but that’s your daily sell zone if you are that way inclined.
Just finally while I’m here, I wanted to end today’s chart dump with STEEM:
STEEM/USD Daily
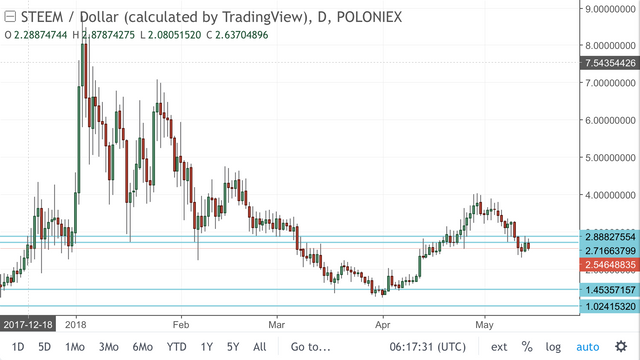
STEEM is looking exactly the same. That is, not ideal. If you’re not out of your STEEM bounce trade longs yet, then you’re just holding on for the sake of holding. Let it go.
Yolo ✌🏻.
@forexbrokr | Steemit Blog
Market Analyst and Forex Broker.

Twitter: @forexbrokr
Instagram: @forexbrokr
I'm afraid of ups and downs, my respect for you mister trader. thanks for the interesting post
There’s nothing to be afraid of if you manage your risk. Position size and risk:reward ratios are key. If you are on top of those, then you have nothing to fear.
thanks for the tip
HY MATE IF YOU DONT MIND CAN YOU PLEASE SEND ME YOUR DISCORD I.D I NEED TO DISCUSS SOME THINGS WITH YOU
I'm forexbrokr on Discord as well.
Coins mentioned in post:
Thanks... I guess.