Forex Analysis Report 11-2-18...AUD/USD Catches A Bid

I last spoke about the AUD/USD two months ago,
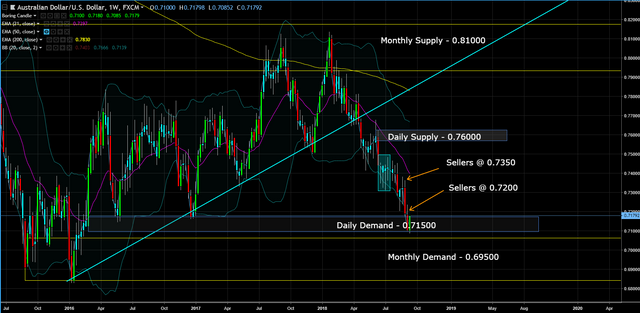
The chart suggests the AUDUSD is going at least another 200 pips lower to the monthly demand at 0.69500.
Two days ago China's leadership signaled that further stimulus is being planned to counter the economic slowdown. The Shanghai Composite index, stocks 1.2 in Australia, New Zealand, and South Korea all rose more than 1%. China is a major trading partner for Australia, so this was great news for them.
Also, the Aussie dollar strengthened after the Australian Bureau of Statistics reported an above-forecast September trade surplus recently. The exports rose 1% in September and the imports dropped by 1%, pushing the trade surplus higher to AUD 3,017 million from the August reading of AUD 1,604 million.
Lets go to the charts to see what this all means for the AUD/USD
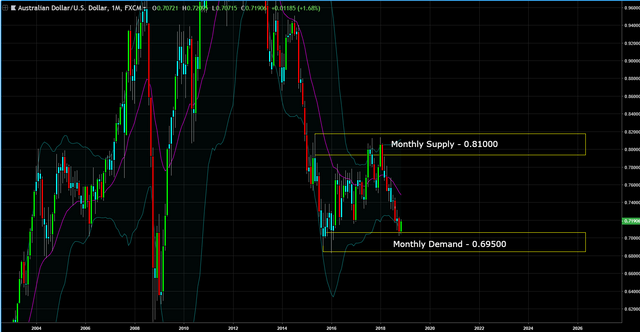
On the monthly chart, price is at an extreme, meaning at the end of the range.
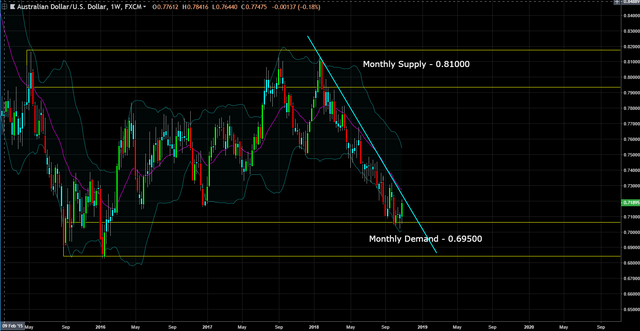
On the weekly chart, price is still in a downtrend.
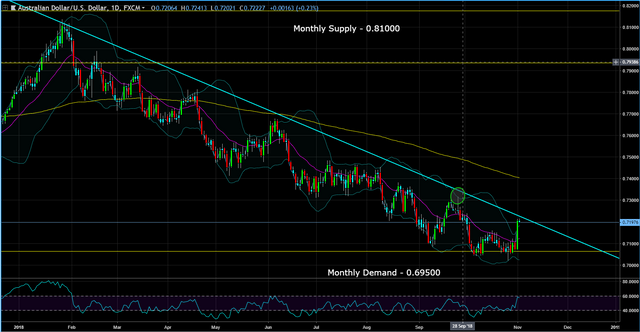
Thus, on the daily chart if price is going to move higher, price needs to take out the pivot high and close above the down trendline.
This post is my personal opinion. I’m not a financial advisor, this isn't financial advise. Do your own research before making investment decisions.
