Forex $1 MM Challenge - Trade #4 (8-7-18) Sold AUDNZD @ 1.10190; Stop: 1.10717, Take Profit 1.08000...Stopped Out For A Loss

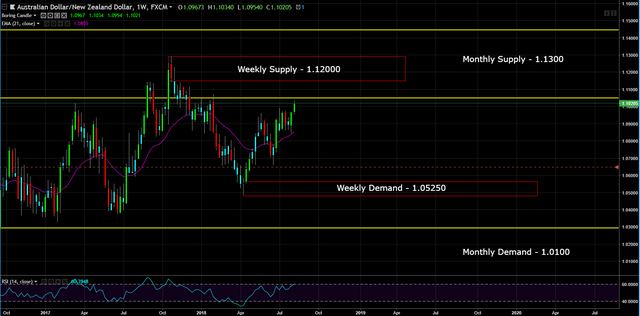
Monthly Chart (Curve Time Frame) - monthly supply is 1.13000 and monthly demand is 1.01000.

Weekly Chart (Trend Time Frame) – price has been range bound and approaching the upper extremes of the range.
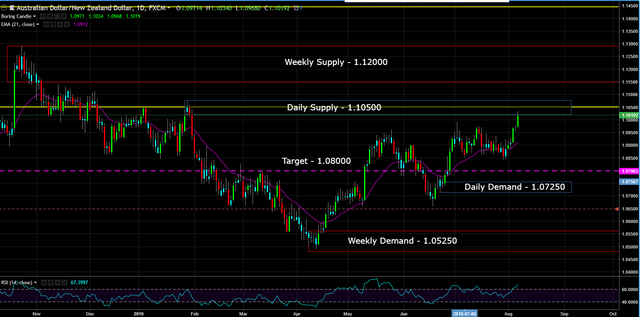
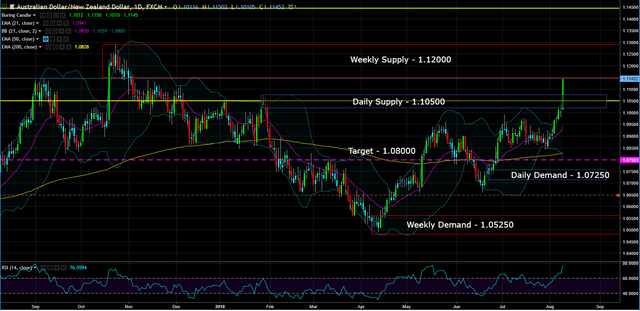
Daily Chart (Entry Time Frame) – price came into the daily supply zone at 1.10500. I took the trade due to the strong move away at the beginning of Feb. and because of the wick at the beginning of July which denoted sellers above.
Risk – 1% of Account
Buying – 5.5 mini lots (the zone was fairly large, so I had to limit the # of mini lots)
Order – Market Order @ 1.10190
Stop Loss – 1.10717 or 52 pips
Target – 1.08000 or 218 pips
Reward to Risk Ratio - 4 to 1
Today I was stopped out when RBNZ announced a dovish hold on their interest rate at 1.75%.
This post is my personal opinion. I’m not a financial advisor, this isn't financial advise. Do your own research before making investment decisions.

Published on

by rollandthomas
