Gold Volume Alert – Continuation or Reversal of Trend Imminent

Sudden shifts in volume characteristics always precede short-term or long-term trend reversals, or decisive continuations. In my gold technical analysis published on Apr. 15 and May 28, a spike in buy volume freaked meowt when price
retested resistance just below the $1,380 line in the sand. The shift in trend to the downside was not a complete surprise, but it was counter-intuitive based on fundamental and technical analysis. Modern algorithmic automated platforms and intermittent cartel intervention are a cruel joke on human mercantile sense. What is currently taking place in the world of volume is not a joke.
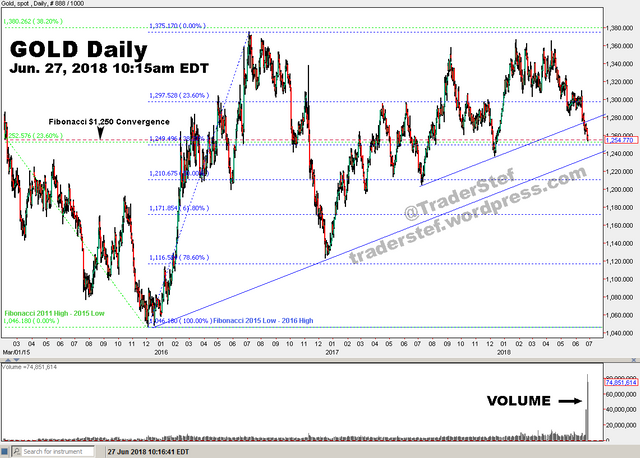
My most recent technical analysis on Jun. 15 reinforced the fact that despite a rollover in price since $1,300 was breached to the downside, which coincided with big pockets building upside positions on large volume, no major technical damage occurred on the weekly chart. A $1,252.34 low printed in New York this morning, but has not breached a Fibonacciconvergence level and a trendline that would result in serious technical damage to the weekly chart. As the price drama plays out, mainstream financial media is howling over a potential Death Cross taking hold on the daily chart, but ignore the Golden Cross that remains in play on the weekly chart.
Here is the skinny. Since 5am EDT on Monday Jun. 25, gold spot volume has dwarfed any previous historical data. Nobody that followed gold over the last two decades has witnessed such an event. It does not appear to be a glitch in a feed, because the pattern holds firm when drilling down through all periods from 1 second up to the monthly. The current increase is nothing short of incredible, and is a battle between large speculators, the bullion banks, shorts and longs. Unprecedented paper positions on the buy-side of the ledger are humming along because it is a very low risk price zone from a fundamental and technical point of view.
A potential SHTF event may be brewing in the global litter box and you are seeing it here first. Chew on this catnip treat for a moment…
Gold spot weekly chart as of 10:15am EDT Jun. 27, 2018…
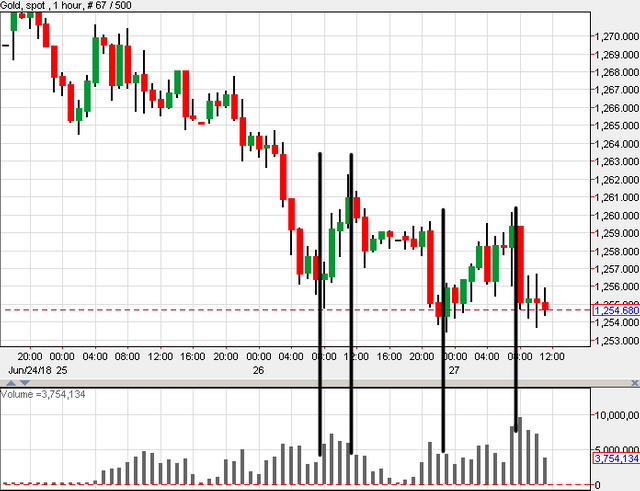
A snapshot of the gold hourly chart indicates where the bulk of buy volume came in…
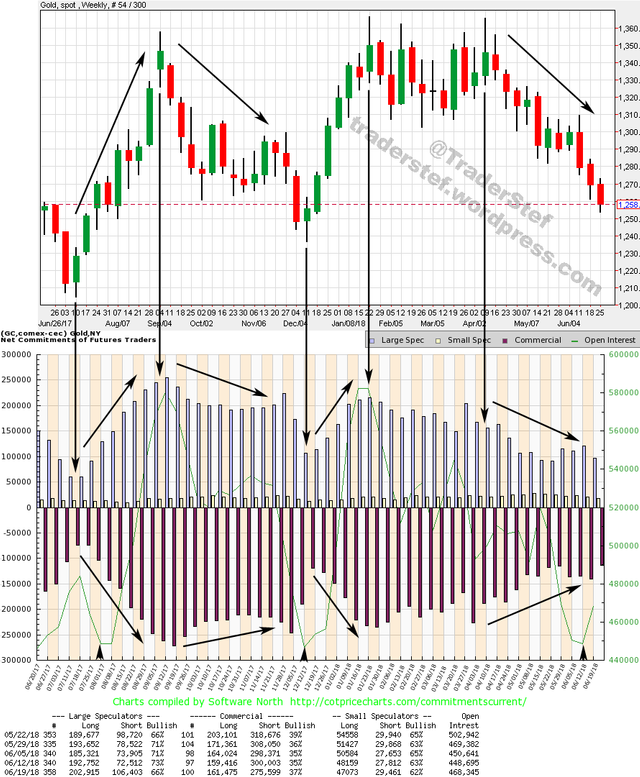
Here is the most recent Commitments of Traders (COT data as of Jun. 19 and reported on Jun. 22), overlaid with the weekly gold price chart as of 10:15 am EDT, Jun. 27. Note the COT net positions pattern of highs and lows, and total Open Interest (OI is the fine green line, with lows marked by arrows at the base) vs. the gold price candlesticks.
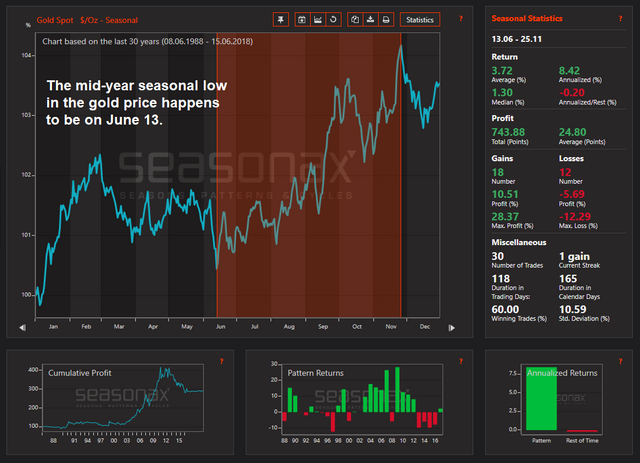
As a reminder, here is gold’s seasonal 30-year average as of June 2018…
I will add three relevant news items today as the financial universe ponders if Deutsche Bank will be an Ice-Nine Lockdown credit crisis trigger.
A New Global Debt Crisis Has Begun_ – Jim Rickards, Jun. 21_
Swiss Gold Refiners Backed Up Until August – Demand Strongest Since 2013_ – Andrew Maguire, Jun. 22_
Deutsche Bank Tumbles To New Record Low, Drags European Banks… “What caused the slump? As Bloomberg’s Paul Dobson writes, there is plenty to worry about besides the usual worries about trade wars, emerging markets, and Italy, including hedge funds warning of a crisis, talk of higher counter-cyclical buffers, as well as sliding bond yield’s and the deflationary bogeyman for European bank, which in turn is sending European credit risk higher this morning. It appears that whatever risks were latent and starting to emerge as a result of trade war concerns is starting to spread as contagion now hits Europe’s arguably most sensitive sector.” – ZeroHedge, Jun. 27
Plan Your Trade, Trade Your Plan
TraderStef on Twitter