Cold Climate Begins as Sun’s Output Weakens, What Will We Eat?
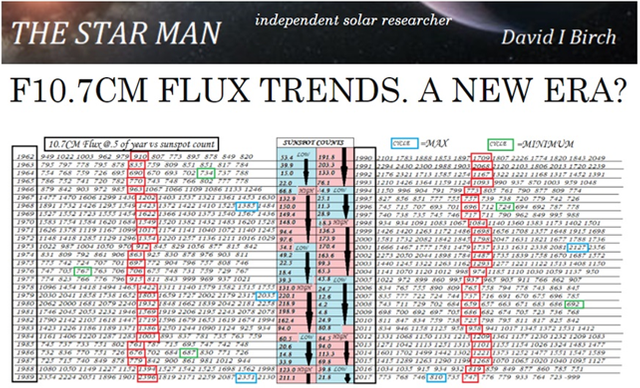
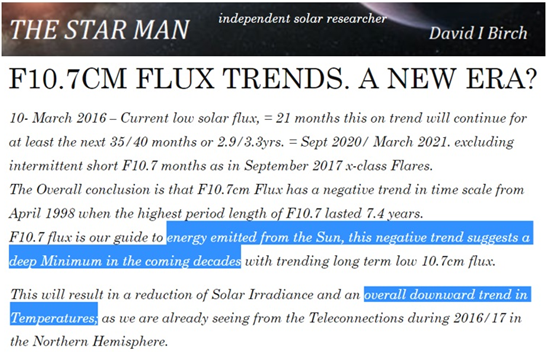
(BELOW) Starting off here with the Starman David Birch, his article detailing the number of sunspots along with it 10.7 centimeter flux, details the trends in decreased solar activity. To read this chart, right in the dead center you’re going to see the sunspot count, and it depends if it’s increasing going into the Solar Maximum or decreasing going into the 11-year Solar Minimum that we’re used to. You’ll notice a bunch of different coded colored boxes in there. I’m focusing on the blue box that is the “maximum” during a Solar Cycle, I put the purple arrow there so you can see where we are 2017 and if you notice 810 that is the lowest anywhere on this chart coming back to 1962 and it is absolutely forecast for that to drop off even lower from this point forward.
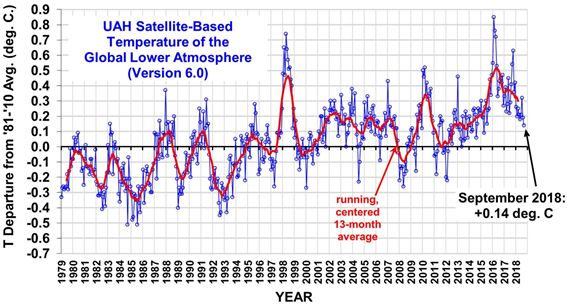
With that being said solar activity here we are, University of Alabama Huntsville (UAH) global temperature update September 2018, global temperatures have dropped yet again.
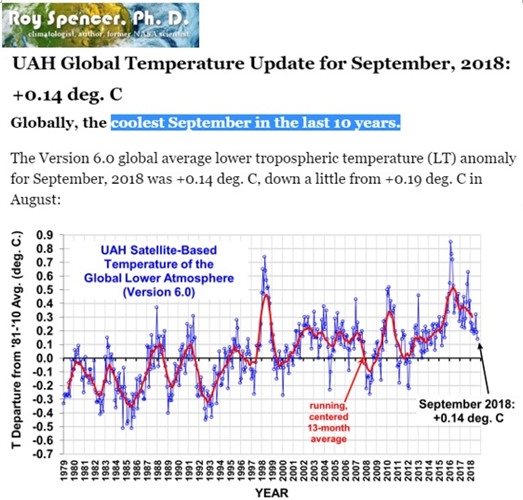
We were told it was the warmest year ever, the hottest summer ever, yet the global temperatures dropped all through this record heat summer. Interesting how that is the opposite of what they’re telling you in the news? What the science is telling you with the data?
Taking a look at this chart here in a more numerical value so we can see regions of the planet in 2017 September, compared to 2018 September. You can see more clearly where these global temperature drops are occurring, It’s broken down by global, which is dropped four tenths of a degree, Northern Hemisphere, Southern Hemisphere. If you go over to the right side the second from the right, you’ll see the Arctic region has dropped the most in this last year. The “experts” told us Arctic temperatures were warming, it’s the all-time hottest Arctic ever, yet the temperatures dropped over the entire year by more than eight tenths of a degree.
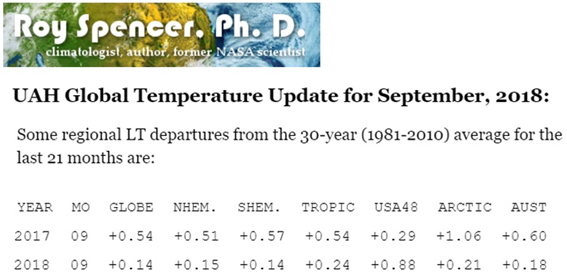
Tucker Carlson had Dr. Roy Spencer on his program and since global temperatures are dropping, global warming hysteria has to change narrative, what they now trying to say is the number of hurricanes are caused by CO2.

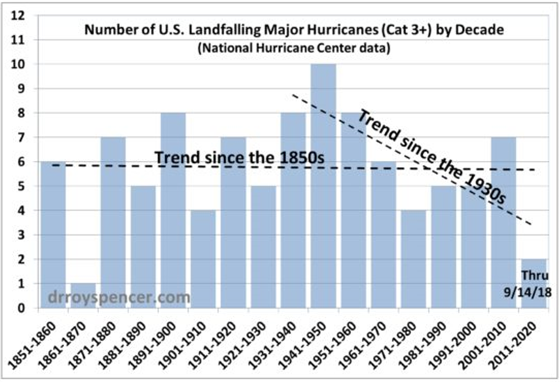
Going back to 1851 and taking a look at how many hurricanes there have been so far in this decade from 2011 to 2020. I know it’s a year out, but look how low that is, taking us back to 1861 to 1870. The trend line is down since the 1930s and the “global warming is causing more hurricanes” narrative seems to be falling apart at the seams everywhere you look in this battle for the CO2 tax.
Back to the Starman, 10.7-centimeter flux and the energy emitted from our Sun is in a negative trend, suggesting a deep Grand Solar Minimum in the coming decades. As forecast, this is going to result in an overall downward trend in global temperatures, starting in the Northern Hemisphere you are looking for something at least in the coldest in 50 years, possibly up to 60 years this winter 2018 and 2019.
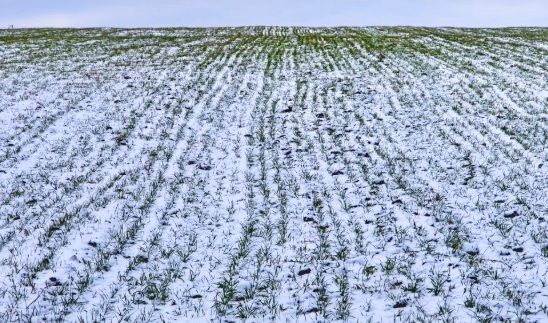
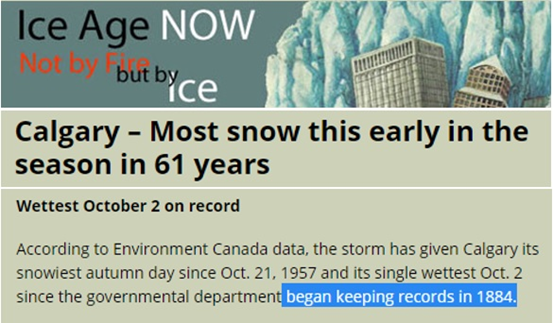
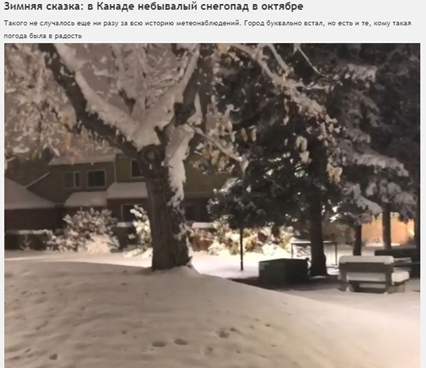
Under Robber Felix’s site “iceagenow.info” Calgary most snow this early in the season in 61 years. It’s the snowiest day on record since 1957 but it’s the wettest October 2nd on record, and these records began back in 1884. We’re start to now getting the half century and over a full century records being broken for precipitation and snowfall both with record cold temperatures.
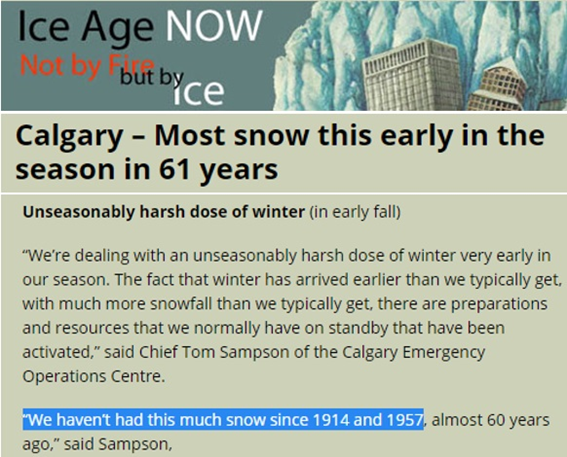
If we take a deeper look into the actual times that these most epic snowfalls happen in Calgary, we have to go 1914 and 1957. It’s one of those two that we’re going to repeat this cycle coming into 2018–2019 winter, looks like it might be on the 100 year cycle 1914, 2018 that’s a century give or take a few years or it would be at the half century mark back in 1957.
This snow is so unprecedented and so rare and so deep it broke their records by five times the previous totals that it made Russian news outlets.
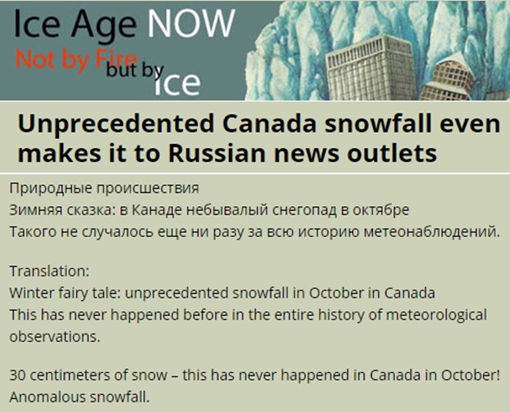

Here’s a couple images coming off of what the Russian media is covering on how rare and unusual this event is.
Showing you a few snow here, I left the Russian translation up.
Digging through their website also at “METEATB” Russia also experiencing the exact same thing early snow killing thousands of hectares of grain, this is in eastern Siberia squally winds lowered temperatures heavy snow.
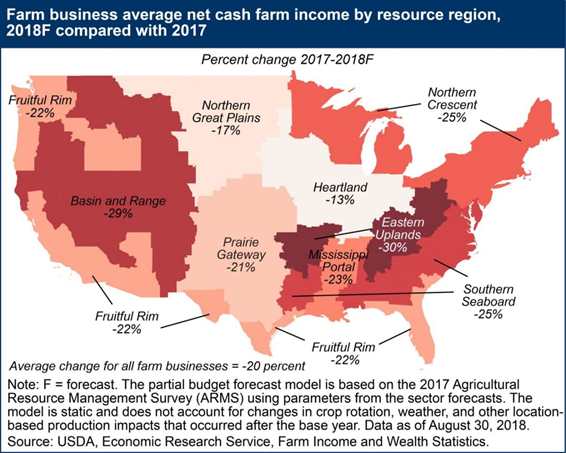
When we are talking about crops and food production, the farm business average net cash farm income 2017 compared to 2018, look at the fruitful rim West Coast -22% as well as down in Texas, in Southern California. How about the basin and range -30%, you can check out the Resource Management Survey and what they peg it to is changes in crop rotation & weather, then other location-based production impacts which they don’t list. I was told we were having bumper crops across every region of the United States, now if that’s the case, how are these farm businesses losing money across our country?
Thanks for reading, hope you got something out of the article. You can find the graphs and images in a blog format here steemit.com/@adapt2030.
As always the tri-weekly podcast Mini Ice Age Conversations covering this same information in more detail on the intensifying Grand Solar Minimum and how this can affect your food prices and ultimately your life.
*** ADAPT 2030 True Leaf Market Link ***
http://www.pjtra.com/t/SkNITkxPS0xDR0...
ADAPT 2030 My Patriot Supply Links: Take the fear out of difficult situations
2-Week Food Supply: (1,500+ calories/day with 92 servings) www.preparewithadapt2030.com Hearty Soups Kit with 104 servings http://bit.ly/2A4c1hk
Mini Ice Age Conversations Podcast
MIAC #120 Australia is Entering a Mega Drought the Repercussions
http://adapt2030.libsyn.com/miac-120-...
Grand Solar Minimum Book of the Day
Gardening When It Counts: Growing Food in Hard Times
Designed for readers with no experience and applicable to most areas in the world except the tropics and hot deserts. This book shows that any family with access to 3–5,000 sq. ft. of garden land can halve their food costs using a growing system requiring just the odd bucketful of household waste water, perhaps two hundred dollars worth of hand tools.
*** Today’s Story Links ***
Sunspot highs and Lows https://divorbirch.wordpress.com/2018...
The Version 6.0 global average lower tropospheric temperature (LT) anomaly for September, 2018 was +0.14 deg. C, down a little from +0.19 deg. C in August:
http://www.drroyspencer.com/wp-conten...
http://www.drroyspencer.com/2018/10/u...
U.S. Major Landfalling Hurricanes Down 50% Since the 1930s
http://www.drroyspencer.com/2018/09/u...
Calgary — Most snow this early in the season in 61 years
https://www.iceagenow.info/calgary-mo...
https://calgary.ctvnews.ca/city-calls...
Unprecedented Canada snowfall even makes it to Russian news outlets
https://www.iceagenow.info/unpreceden...
http://www.meteo-tv.ru/news/Prirodnye...
Early snow killed a thousand hectares of grain in Transbaikalia
http://www.meteo-tv.ru/news/Prirodnye...
MIAC #105 Substantial Crop Losses Globally & The Economics of Rising Food Prices
http://adapt2030.libsyn.com/miac-105-...

*** ADAPT 2030 Social Media Links ***
1.) PATREON www.patreon.com/adapt2030
2.) BITCHUTE https://www.bitchute.com/hashtag/adapt2030/
3.) STEEM https://steemit.com/@adapt2030
4.) *** ADAPT 2030 True Leaf Market Link ***

5.) Mini Ice Age Conversations Podcast
Libsyn: http://adapt2030.libsyn.com/
iTunes: https://itunes.apple.com/us/podcast/adapt-2030-mini-ice-age-conversations/id1200142326
6.) FB https://www.facebook.com/Miniiceage
7.) TWITTER https://twitter.com/adapt2030
8.) YOUTUBE www.youtube.com/user/MyanmarLiving

9.) MEDIUM https://medium.com/@globalcooling