Winds of Change Blow in Bombogenesis Ulema
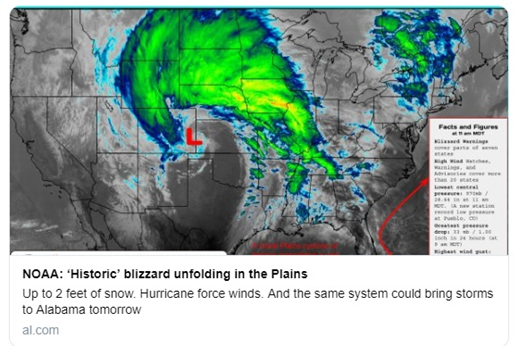
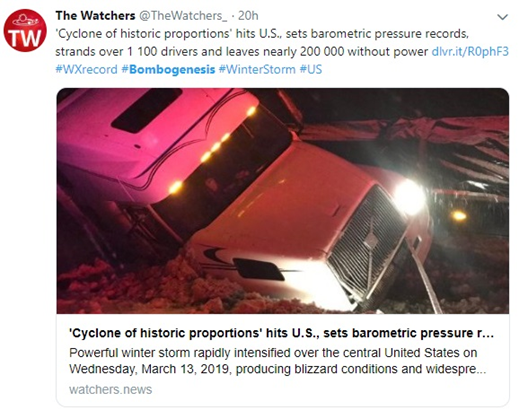
There was more to this bombogenesis that meets the eye, very unusual indeed. Even NOAA wrote it as historic in their headline, with 2 feet of snow and gale-force and hurricane-force winds.
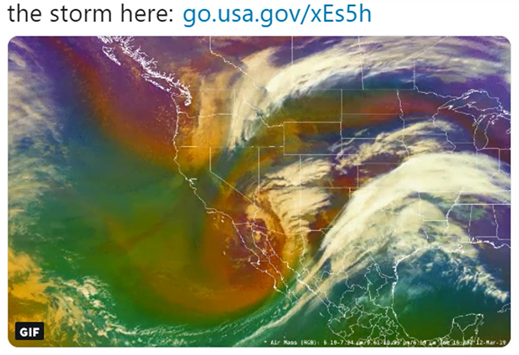
This was all due to an unusual jet stream set up on March 7th pushing a huge front dumping record snows in the Sierra Nevada Mountains. The atmosphere was bent around the Sierra Nevada Mountains and what emerged on the back side, in Arizona, was all-time record flooding. Death Valley also flooded, and that was the impetus and seed point to get this rotation moving.
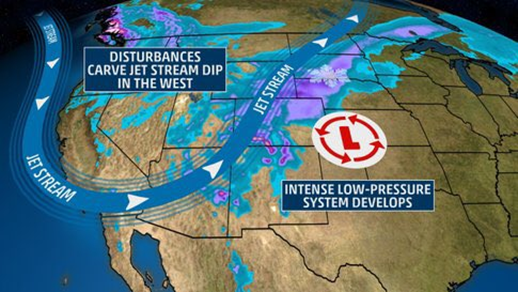
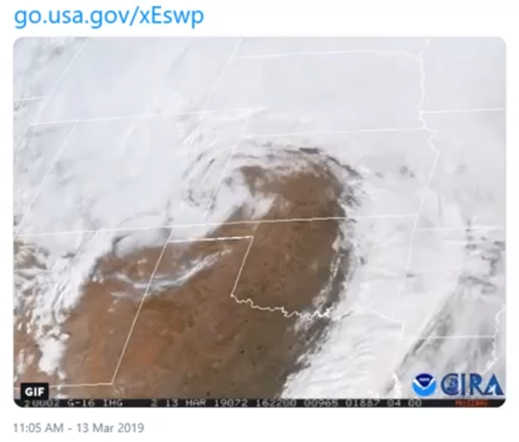
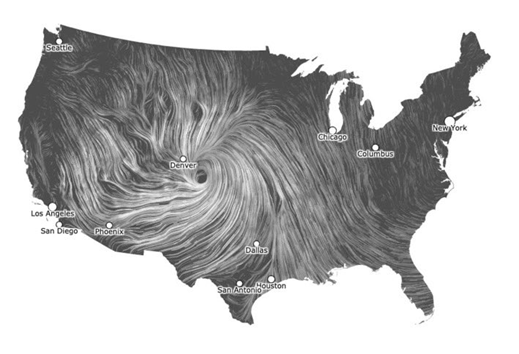
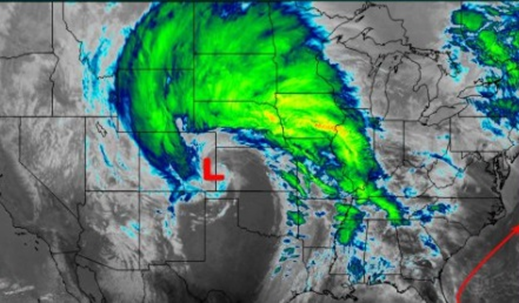
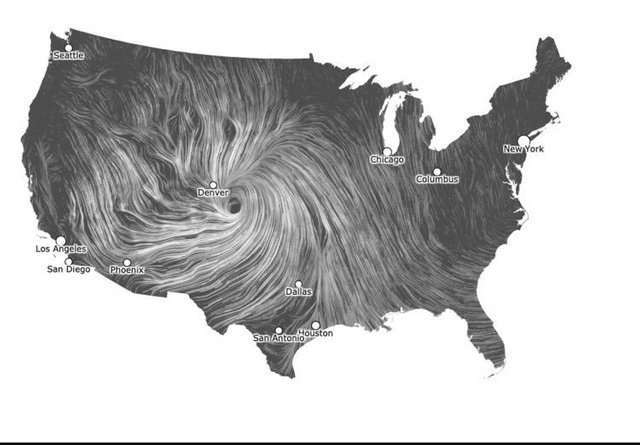
Here is a more simplistic graphic showing the disturbance carved in the jet stream due to a weakening magnetosphere, which is brought by low solar activity. This ended up being a Bombogenesis over land, which is incredible.
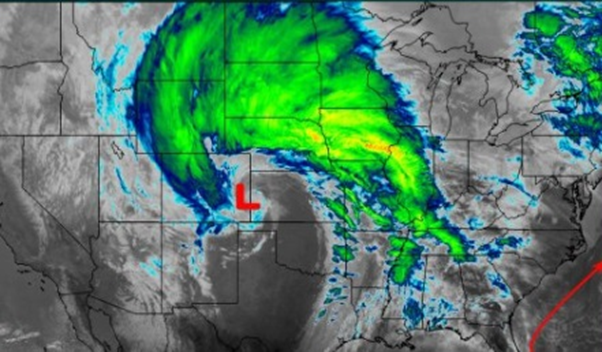
You can see right in the center not only the cyclonic motion, but the clear air pushing up. The winds were ferocious with this front accompanied by extreme precipitation events across the US corn, soy and wheat growing regions.
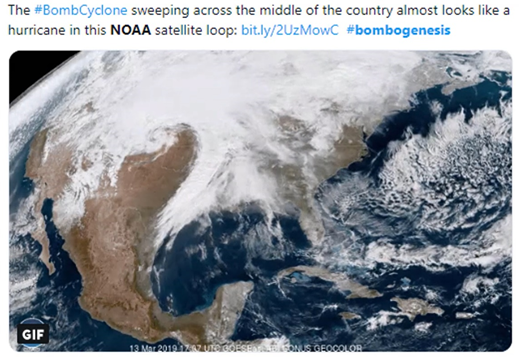
If we look closely in the continental US and over Canada, the entire system is going to pass through the Great Lakes and up to Canada. These places are going to be pelted with an enormous amount of flood damage.
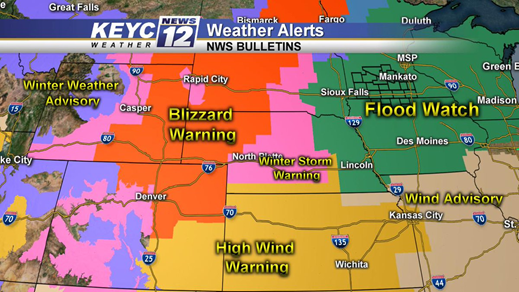
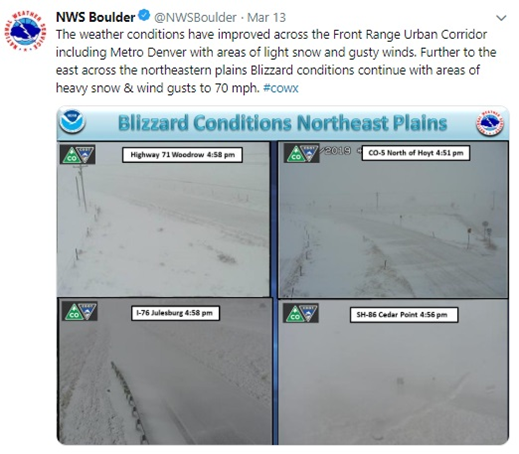
So what was left in the wake of the storm passing through the plains? Well, blizzard warnings, high wind warnings and flood warnings are all over the place.
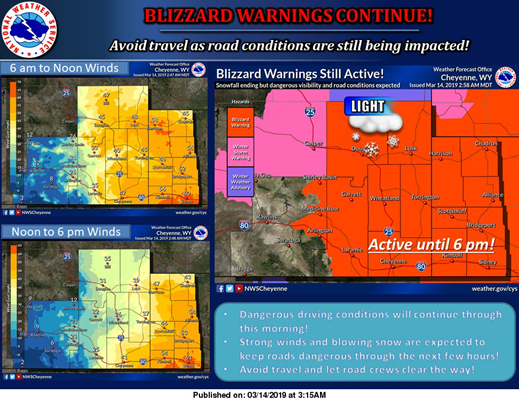
And the blizzard warnings continued.
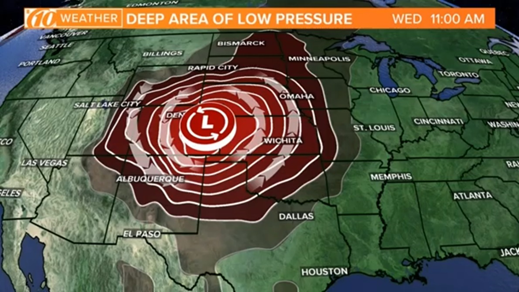
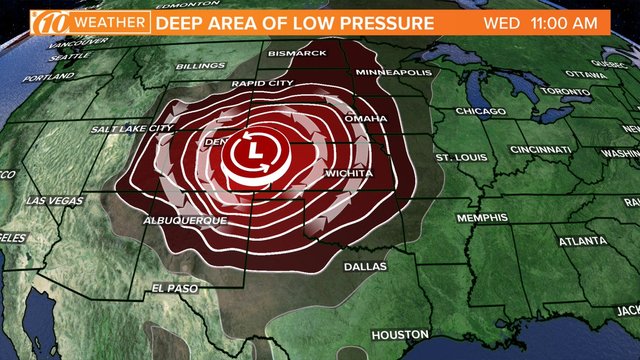
Take note of this simplified version of the low pressure area and notice its scope in terms of where the low pressure area and the periphery winds are.
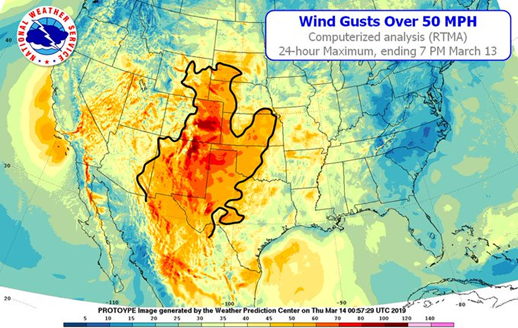
In addition, everywhere on this NOAA Weather Service map shows winds over 50 miles per hour. Inside that black outline is literally an extreme hurricane-force winds. This has a force of a Category 1 hurricane at 100 miles per hour with the snowdrifts.
Did you hear about blizzards? This was the true representation of how it was.
Winds during the blizzard were moving so fast, that everything got buried in the drifts that caused any type of resistance against ground winds.
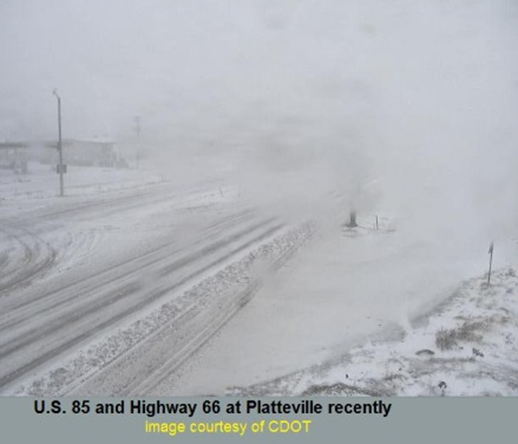
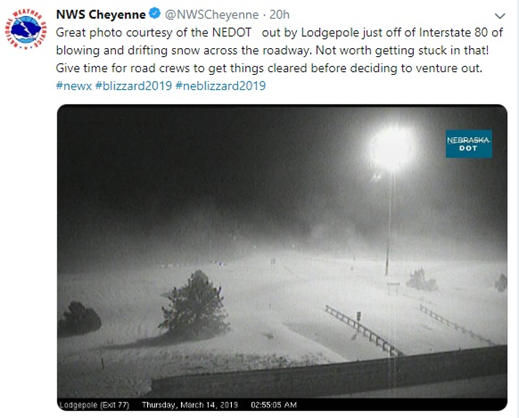
All the highway cams indicated a non-conducive driving condition, which was either due to these huge squalls or complete whiteouts. Imagine driving through that.
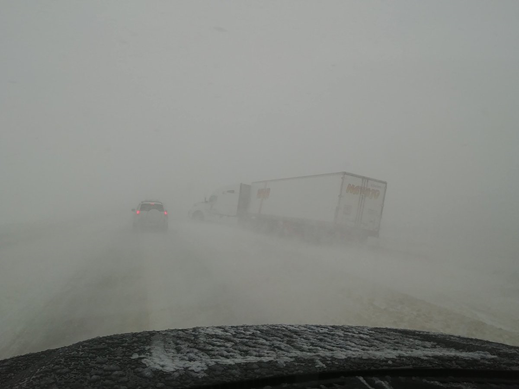
These exact same headwinds and icy road conditions were non-stop for twelve hours.
Moreover, drifting snow covered an enormous amount of our delivery system infrastructure. If you look at the closed interstates during this storm, you realize, without half of the map but Texas we have I-94, I-29, I-80, I-25, I-70, I-76, I-90, another I-70 west which is a different place, and all interstates in the Nebraska Panhandle are closed.
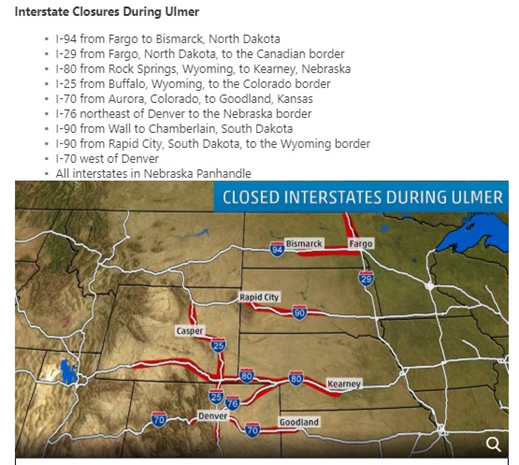
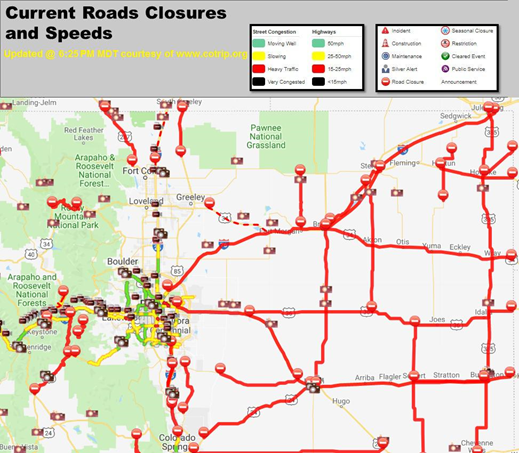
(BELOW) Then going down to Texas, a vast array of closures. These were all the road closures from Colorado Springs and periphery areas, 550 miles off Interstate in Wyoming.
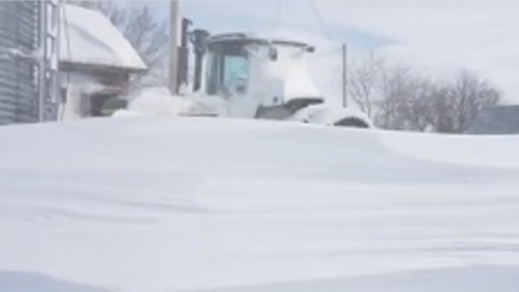
Now, some of these images came out. These images show farm equipment buried in the drifts. The barns are on the left and the tractors are on the right.
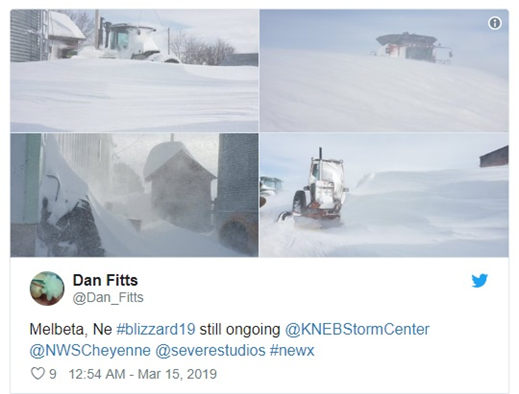
If you enlarge the top left image, you can get a good indication of how quickly your car would not be able to move if you were driving on the roads and got became strended.
Looking at the wind maps, southeast of Denver actually looked like that eye of a hurricane.
Also, the University of Wisconsin, Madison showed that an all-time record low pressure was broken during this storm. Something in our atmosphere has definitely just up ticked and shifted.
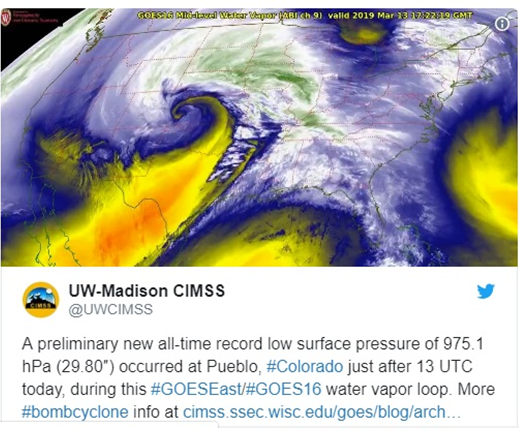
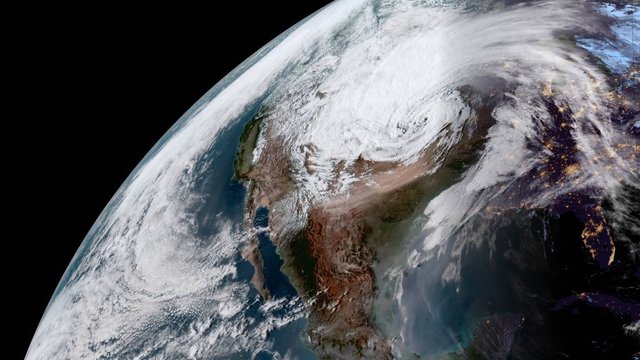
Up close, you can notice the large central spin, but off to the right, over into the southeast US, those two frontal boundaries are noticeable as a split.
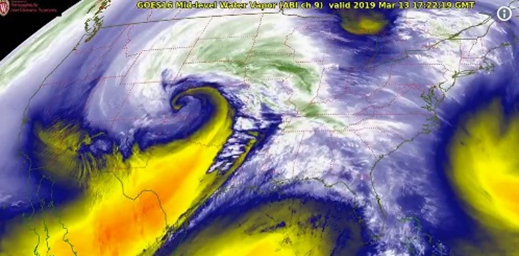
As this thing continues moving northeast, it is spreading off in the direction of the arrows. The two arrows at the bottom points to the area where flood warnings were issued.

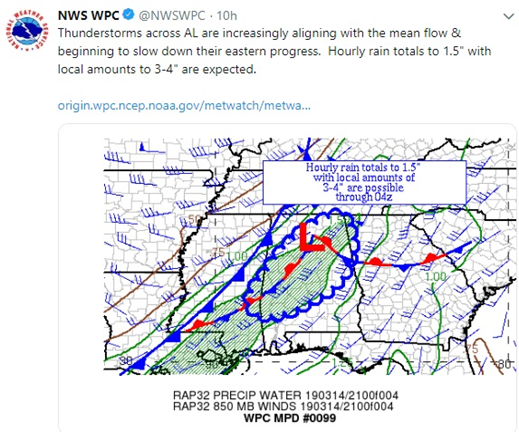
Flood warnings were issued for Alabama, moving up to southern Tennessee and Georgia. They had up to 4 inches of rain already.
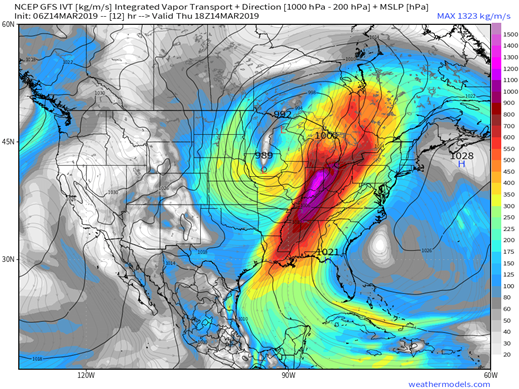
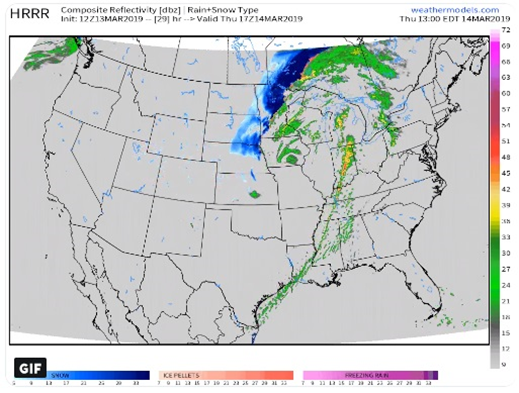
This event was everywhere colored on this map, look at the moisture that was moving with this front.
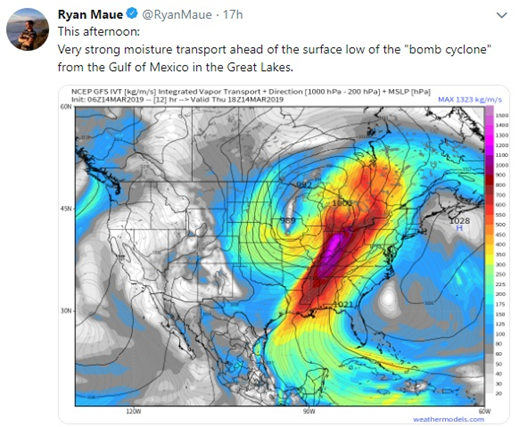
If that image is widened, you can see that the moisture extends all the way up to the New England states, or all the way down to the coast. Wherever you see coloration that is not yellow, anything else inside there is extreme rains coming down. Expect unusual weather, to say the least.
Meanwhile, this was the forecast on the 15th, 16th, and 17th of March. That dark-blue was where the extreme moisture was.
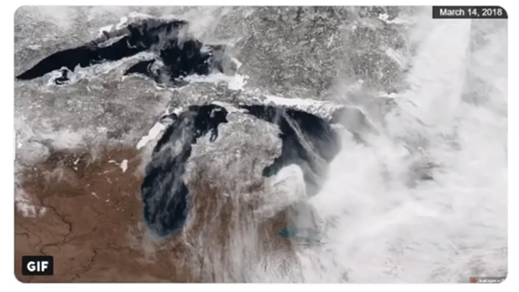
On the other hand, look at how the atmosphere was behaving preceding this event in the Great Lakes region. It was rolling and spinning in.
After this storm swept through, record cold followed, not only with the minimum wind chills, but some of these were even below zero Farenheit, but a lot of these readings were at 2 degrees Fahrenheit and 5 degrees Fahrenheit.
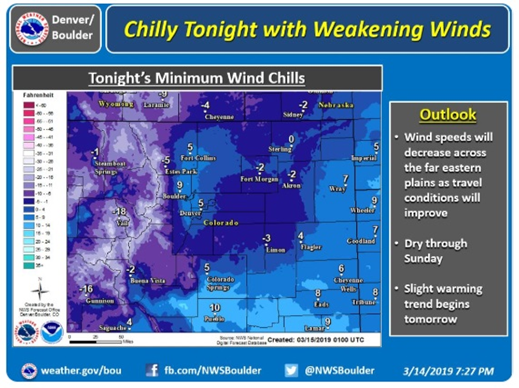
Those temperatures were a little low for this time of the year. I wonder how conducive the ground will be to sow seeds and make them grow in our grain belts, with all the extra wet and cold.
Moving on to wind gust reports which pretty much covered everywhere in the reds and pinks on the map. Those were massive wind fronts moving through.
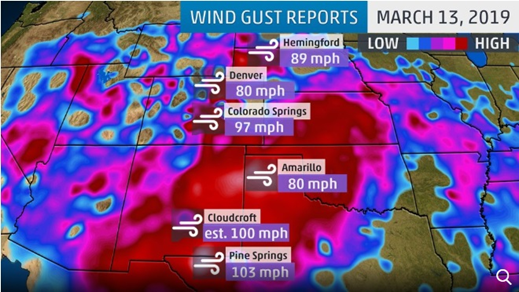
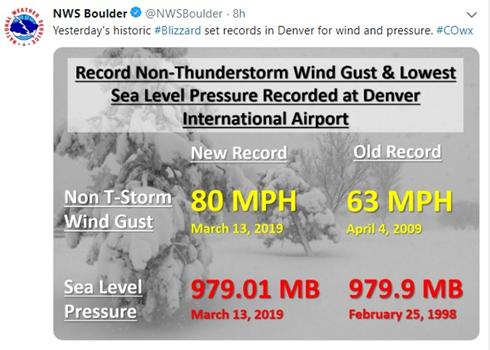
This overlaying hurricane cyclone of historic proportions broke another all-time barometric pressure reading. This was the second time during this storm. The record was set at 979.01 from 979.9 in 1998. It was almost a full millibar down, and look at the new wind speed record at the Denver International Airport. The old record was at 63 miles per hour while the new record is at 80 miles per hour. This is a little more than 20% increase in the wind velocity.
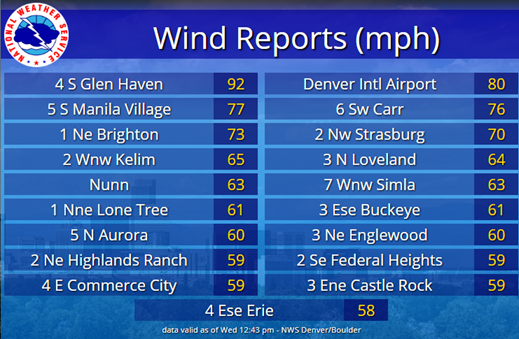
Wind reports came out of Colorado as well at 92 miles per hour, and Denver International at 80 miles per hour. The same types of wind speed had been reported everywhere, as shown below.
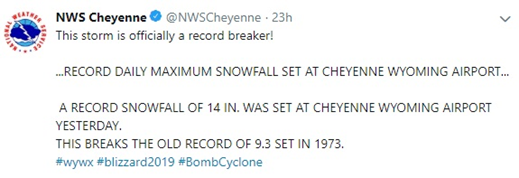
With these record snowfalls, Cheyenne Wyoming broke the old record of 9.3 inches in 1973. The new record is now 14 inches. This is a substantial jump from the old record.
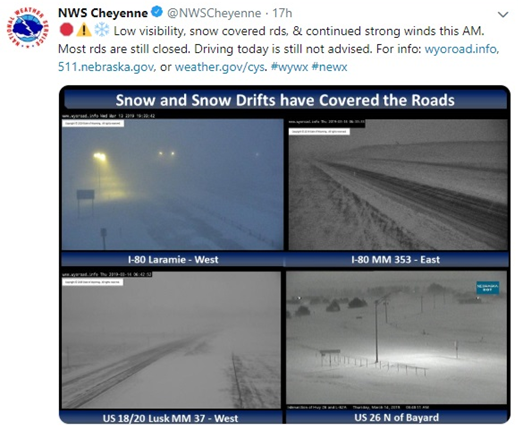
And in the same areas, they were so lucky to have the street cams because these were how the road conditions looked like on the interstates in Wyoming.
It was so windy that 26 rail cars were blown off, crossing that trestle. These rail cars were blown off the tracks. They say it was 104 miles per hour, but I think it had to be higher to dislodge 26 rail cars.

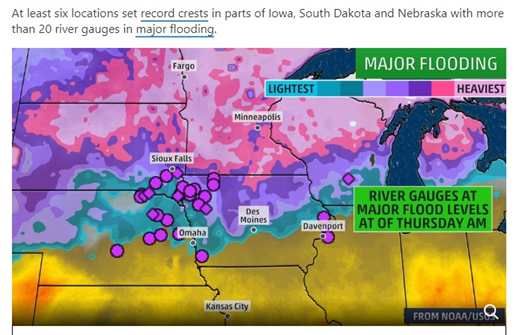
The Bombogenesis cut straight through the central US and as it did, there were massive flood events associated with the storm and six different record crests. This is an all-time, most ever recorded water levels in these rivers, where 20 river gauges showed major flooding.
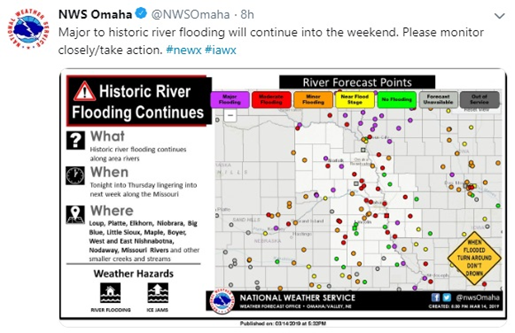
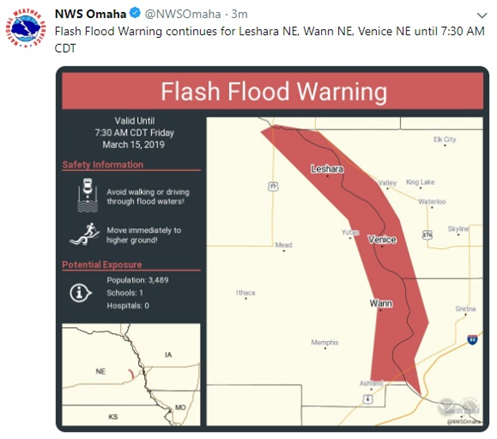
More historic river flooding recorded, this time, it was in Nebraska. You should be amazed by the amount of flood water in the event that these dots registered.
For your information, Nebraska is a major grain producer and from the air, this was what it looked like in major cities and towns already.
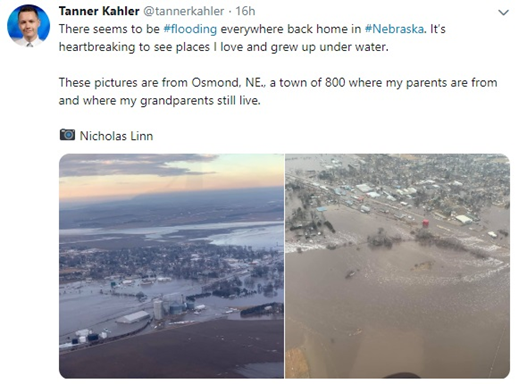
You can clearly see the fields in these pictures. What do you think the planting conditions are going to be like when soils are going to be cooler and wetter? Why doesn’t anybody want to bring up the Grand Solar Minimum when we talk about climate so we can get ready for these changes?
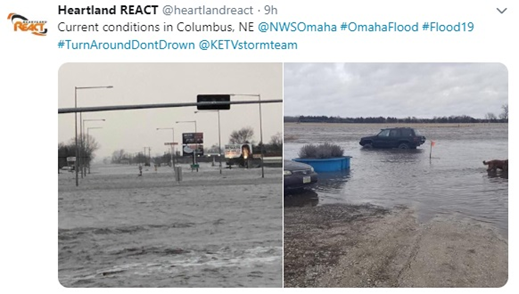
Here it goes, flooded fields, delayed plantings and flash flood warnings yet again, and it just keeps rolling.
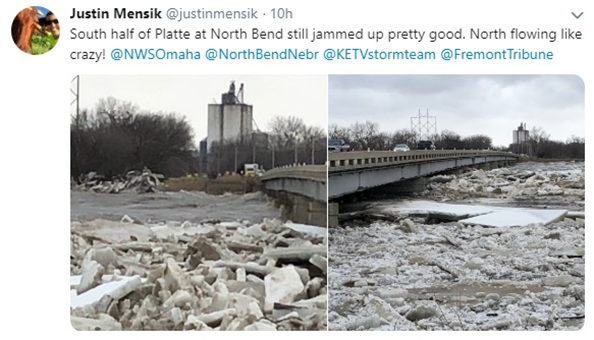
These record floods had broken all the ice that was in the rivers, showing that water is more powerful than ice pushing record ice floes right along with it.

National Weather Service put out this side-by-side chart of two different historic cyclones which were 26 years and 1,500 miles apart.
This is quite interesting. The left side is in 2019, this is the current storm. Over on the right was in1993. Now look at the black and white bottom images, can you notice a difference in the intensity of these two storms?
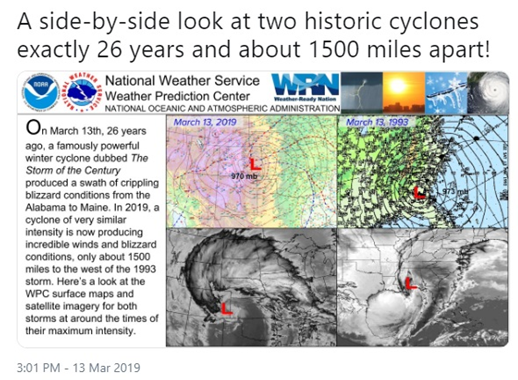
Let me zoom the bottom left image further. Intensity is incredible and looking at this map, heads-up on the Great Lakes, because where that yellow/gold is going that is massive flooding on your door step.
(BELOW) To summarize, I decided to put these Bombogenesis events together. The top graphic was in 2018, the January Bombogenesis, while the bottom is the current. Can you notice the difference in their locations?
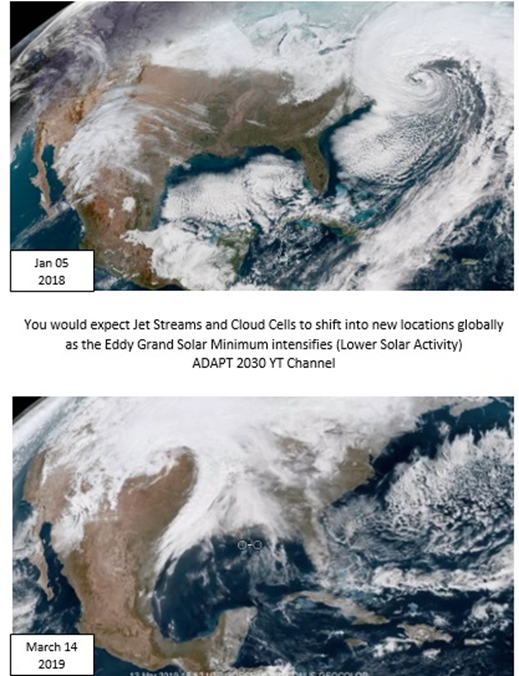
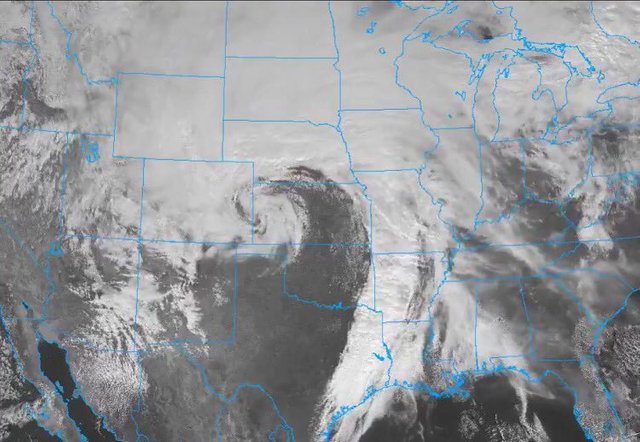
Likewise, this satellite image is equally mesmerizing showing an entire second band pulling further south to Mexico all the way down through the Yucatan, and behind that there are another set of storms as well.

These changes in the atmosphere were forecast using the Sun’s activity. The wider the wave that you see in this chart (below), one magnetic field is canceling another magnetic field on the Sun. The two different colorations in the graph, the red (south) and the blue (north) lines magnetic fields. The wider the wave gets, the more intense the weather on our planet is. We have just crossed over from the yellow into the green of solar cycle 25.
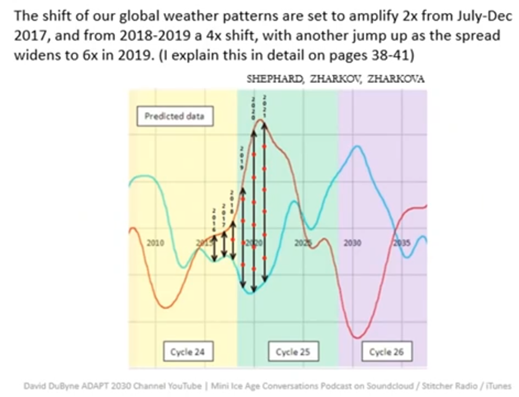
And as you can see, we have to pass through more amplifications before the atmosphere has a chance to really stabilize into its new position. This is all because of the declining solar activity in a mappable repeating period.
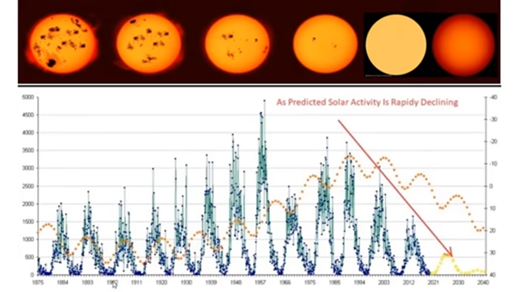
Our Sun is going through a 400-year cycle, and the basic equation states that, the lower the solar activity, the more extreme our weather is going to become on Earth and the more disrupted our Agriculture will become.
Thanks for reading, I hope you got something out of the article. If you like more information like this I produce the tri-weekly podcast Mini Ice Age Conversations, 30 minutes of in depth analysis on the GSM you can take on the go.
Mini Ice Age Conversations Podcast
iTunes: https://itunes.apple.com/us/podcast/adapt2030
Soundcloud https://soundcloud.com/adapt-2030
Libsyn http://adapt2030.libsyn.com/
(MIAC #205) When There Are Food Riots in Cities, Are Governments Ready?

For the bi-weekly Grand Solar Minimum climate update newsletter from myself, David DuByne, (ADAPT 2030) jump over to oilseedcrops.org you can enter your email and sign up. Move your mouse around for about 10 seconds and this box will pop up.
Join ADAPT 2030 NEWSLETTER http://www.oilseedcrops.org

“Help support the adapt 2030 channel on brighteon so we can keep Grand Solar Minimum information free to access.”
https://www.brighteon.com/channel/adapt2030
Support ADAPT 2030 by Visiting Our Sponsors
ADAPT 2030 & My Patriot Supply 2-Week Food Supply with 92 servings
www.preparewithadapt2030.com
True Leaf Market Heirloom Seeds ADAPT 2030 True Leaf Market Link
ADAPT 2030 Amazon Grand Solar Minimum Book Store https://www.amazon.com/shop/adapt2030
Upheaval: Why Catastrophic Earthquakes Will Soon Strike the United States https://amzn.to/2E7KbBt
*** Today’s Story Links ***
Blizzard Warnings Colorado National Weather Service
https://twitter.com/NWSBoulder/status/1106125163018358789/photo/1

Winter storm reports
https://www.countryliving.com/life/a26821950/bomb-cyclone-2019/
https://watchers.news/2019/03/14/us-historic-blizzard-march-2019/
Saffir Simpson wind scale 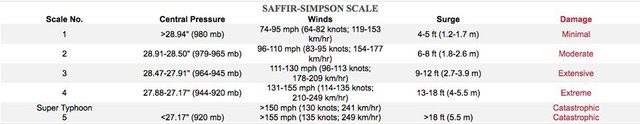

Ice Jams Nebraska 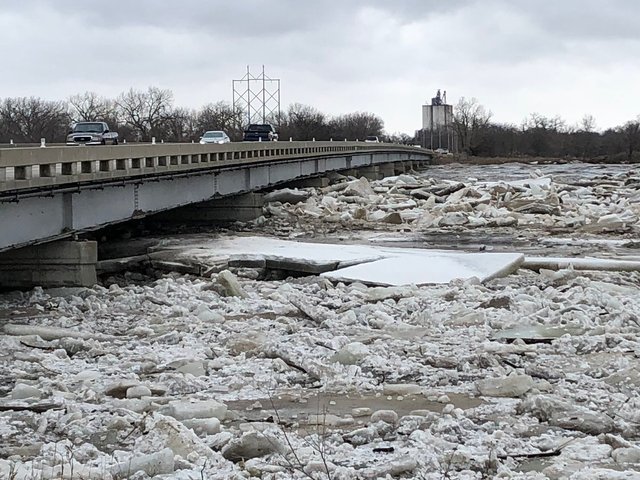
Bombogenesis Satellite images
Side by side different era Bombogenesis
https://twitter.com/NWSWPC/status/1105952167951822848/photo/1
GOES Satellite loops
https://twitter.com/NOAASatellites/status/1105920653897748483
Colorado just set records for winter winds.
*** ADAPT 2030 Social Media Links ***
PATREON https://www.patreon.com/adapt2030
YOUTUBE ADAPT 2030 Mini Ice Age 2015–2035 Series on YouTube
BITCHUTE https://www.bitchute.com/hashtag/adapt2030/
BRIGHTEON https://www.brighteon.com/channel/adapt2030
STEEM https://steemit.com/@adapt2030
MINDS https://minds.com/ADAPT2030
MEDIUM https://medium.com/@globalcooling
FB https://www.facebook.com/Miniiceage
TWITTER https://twitter.com/adapt2030