This seems like a big deal...
Bitcoin just broke out of a 3 month triangle pattern...
Looking at the daily chart of bitcoin I see something that looks like kind of a big deal.
We have bitcoin breaking out of a 3 month triangle/wedge pattern.
Check it out:
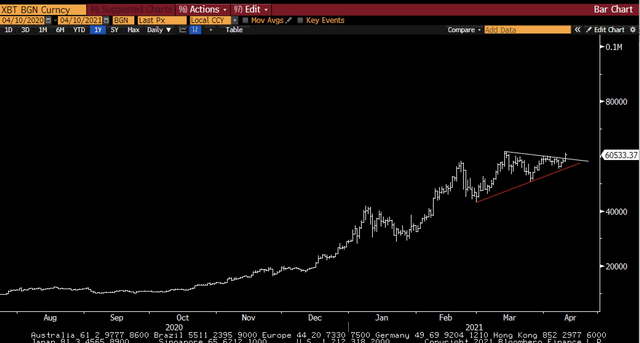
(Source: https://twitter.com/RaoulGMI/status/1380858742015721475/photo/1)
While we may need to break those old highs before the fireworks really begin, this looks like the early stages of the next leg up.
With inflation showing up everywhere, it's no surprise to me seeing bitcoin make another leg higher.
The only question is where this one will top out at?
I'm thinking we go to at least $84k before another big correction, possibly all the way to $100k ish.
What do you think?
Bitcoin is doing exceedingly well.
Nice name!
Thanks @jondoe
In my opinion, you have to focus on your principles and do it carefully. at least the inflation you are calculating is correct. While we may need to break those old highs before the fireworks really begin, this looks like the early stages of the next leg up.
Have a nice.
So nice
I see BTC in an ascending channel visible on daily candles. It has respected it very well and I think it is fighting hard to break $60K. We will soon see BTC above $70K probably.