ASX shares find out best performance shares
In this post, I am going to pick up those companies whose share price increased at least 10%. I will figured out the percentage of these companies in their own industries.
import matplotlib.pyplot as plt
import pandas as pd
import csv
import numpy as np
def DrawBar(df,title_msg):
plt.figure(figsize=(8,4))
label = df['industry']
cmpcount = df['Company Count']
index = np.arange(len(label))
plt.bar(index, cmpcount,0.35)
plt.xlabel('Industry', fontsize=20)
plt.ylabel('Number of Companies', fontsize=20)
plt.xticks(index, label, fontsize=20, rotation=90)
plt.title(title_msg)
plt.show()
def DrawPie(slice_list,labels,colors,title_msg):
plt.style.use('ggplot')
plt.figure(figsize=(8,4))
#explode = (0,0.05,0.08,0.10,0,0,0)
plt.pie(slice_list,
#explode=explode,
labels=labels,colors=colors,
labeldistance = 1.15,autopct = '%3.1f%%',shadow = False,
startangle = 90,pctdistance = 0.6,counterclock = False)
plt.axis('equal')
plt.title(title_msg,y = 1.08)
plt.show()
dataFile = './shares_likely_jump_cashburn_filter.csv'
df =pd.read_csv(dataFile,header=0,index_col=0)
df.rename(columns={"Asx Code.1": "Asx Code"},inplace=True)
print(df.columns)
df_category = df.groupby('industry').agg({'Company Name':'count'}).rename(columns={'Company Name':'Company Count'}).reset_index()
print('all shares is',df.shape[0])
print(df_category[df_category['industry']=='Banks'])
df10 = df[(df['pricediff']>=10)]
df0_neg20 = df[(df['pricediff']<=-20)]
df10_group = df10.groupby('industry').agg({'Company Name':'count'}).rename(columns={'Company Name':'Company Count'}).reset_index()
df_merged = pd.merge(df10_group, df_category, how='inner', on=['industry'])
df_merged['Company Count'] = df_merged['Company Count_x']/df_merged['Company Count_y']*100
df_merged.drop(['Company Count_x', 'Company Count_y'], axis=1,inplace=True)
print(df_merged)
"""
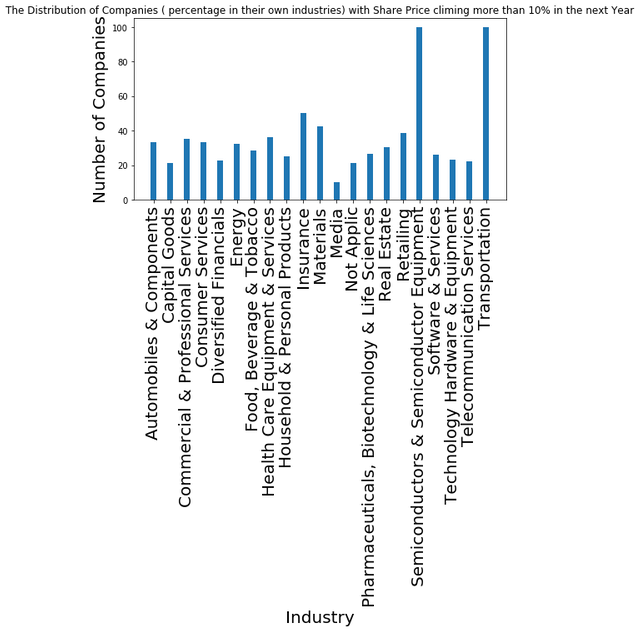
We are going to draw bar chart to indicate percentage of companies with outstanding price changes in the industries.
"""
DrawBar(df_merged,'The Distribution of Companies ( percentage in their own industries) with Share Price climing more than 10% in the next Year')
This is all those industries and the percentage of companies in these area:
                                          industry  Company Count
0                         Automobiles & Components      33.333333
1                                    Capital Goods      21.052632
2               Commercial & Professional Services      35.294118
3                                Consumer Services      33.333333
4                           Diversified Financials      22.727273
5                                           Energy      32.352941
6                         Food, Beverage & Tobacco      28.571429
7                 Health Care Equipment & Services      36.363636
8                    Household & Personal Products      25.000000
9                                        Insurance      50.000000
10                                       Materials      42.647059
11                                           Media      10.000000
12                                      Not Applic      21.428571
13  Pharmaceuticals, Biotechnology & Life Sciences      26.470588
14                                     Real Estate      30.303030
15                                       Retailing      38.461538
16        Semiconductors & Semiconductor Equipment     100.000000
17                             Software & Services      26.153846
18                 Technology Hardware & Equipment      23.076923
19                      Telecommunication Services      22.222222
20                                  Transportation     100.000000
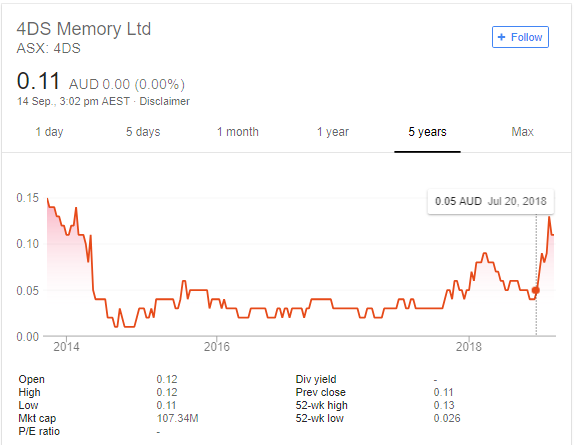
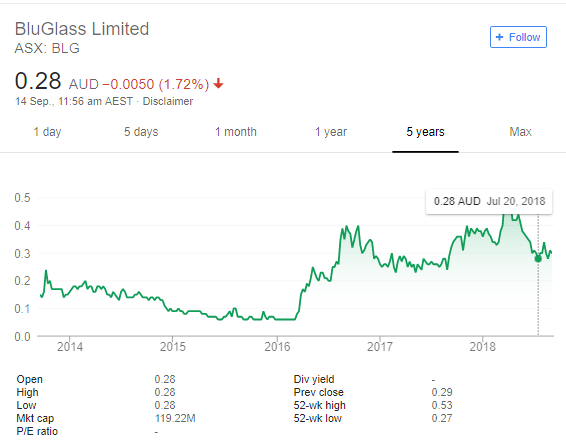
We can see there are two industries in which all companies inside had good share price performance, let's see who they are and their price trend in the market:
df10[df['industry']=='Semiconductors & Semiconductor Equipment']
| Asx Code | Company Name | Finacial Year | Revenue Increase % | industry | pricediff |
|---|---|---|---|---|---|
| 4DS | 4DS MEMORY LIMITED | 6/30/2016 | 1053815.0 | Semiconductors & Semiconductor Equipment | 13.725100 |
| BLG | BLUGLASS LIMITED | 6/30/2017 | 86.0 | Semiconductors & Semiconductor Equipment | 24.898013 |
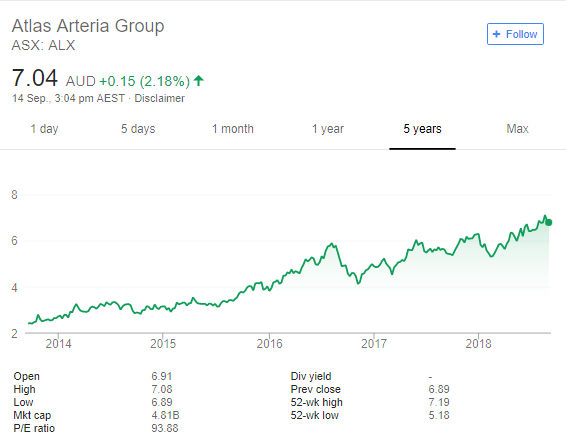
df10[df['industry']=='Transportation']
| Asx Code | Company Name | Finacial Year | Revenue Increase % | industry | pricediff |
|---|---|---|---|---|---|
| ALX | ATLAS ARTERIA | 12/31/2016 | 48.0 | Transportation | 13.94639 |