using financial data to analyze Australian share market with help of python/pandas
I have been on share market since I was a university student when I used my scholarship to trade in Chinese stock market. I have been struggling in the worst stock market in the world which is Chinese market. Also, I did investment in the most cruel market in the world, which is Hang Kong stock market. I survived with some profits in those markets and I did learn a lot, not only about stock market but also about human nature and life. I switched to Australian and US stock markets, I found they are much more efficient and fair than Chinese stock market, they can really reflect the real situation of the economic situation of the country, with severe and excellent supervisions, investors can obtain much more. Recently, I felt interested in quantitative trading using yahoo-finance API to find some good trading strategies. Then Yahoo and Google shut down their finance data APIs and I have to crawl data from website myself. However, I began to aware that to pick up good companies and buy in at reasonable prices and hold is much more important than a good trading strategy.
An enterprise is just like our human being, it has toddler, teenager, youth, adult and when it gets old, it will fall into decay. Some people like to pick up those enterprises that they believe can survive and enter into the next stage of the lifecycle. Some like buy in shares in the mature stage and can have stable dividend. In this series, I would pick up those that just run out of toddler and teenager and into a fast growth stage. An important attribute of this is a jump of revenue in the annual report or quarter report ( I would use annual report in this article ). I set the first criteria to 'CRITERIA_THRELD_VALUE' in my python script and set it to 0.5 which means an income should be at least 50% greater than the one in previous year. I sampled financial data from 2014 to 2018. I was thinking to use market capital as a criteria in the first place, however, in that way, the result would miss such great company as Amazon in U.S. if it exists in Australia share market. So in the first round, I will search out those companies starting to obtain annual income increment of more than 50% than previous one and took a snapshot of that year.
There are 2269 ASX listed companies at the beginning, after the first filter by revenue criteria, there are 741 companies left.
A company with health balance sheet is very important to a real investor, so in the second round, I use the ratio of total debt and total asset as a criteria ( I should use current debt and asset as well, however, to make things simple, I just used total ones ) and set it in my python script to 'DEBT_ASSET_RATIO_CRITERIA = 0.6', this is based on my years of experience in share investment in different market. After this round, there are only 622 companies survived.
'Cash burn' is an important factor for investment, especially when you tried to invest in a start-up. It means the negative net cash flow in the annual report. I leveraged current cash to compare with negative net cash flow in the annual report, and set 'CASHBURN_CRITERIA = 1', which I assume the cash burn speed would remain the same in the next year, and the present cash can sustain for at least one year before the companies raise more capitals from the market. I have observed many companies, although their revenue has been rocketing for continuous years, their share price remain on the ground, if we take a closer look at their cash flow in financial report, the cash burn is too much which means they have to rely on the market to raise more money to survive, thus dilute the right of old share holders. After this round, there are 507 companies left over.
Then let's do some analysis into these 507 companies, how about their share prices performance in the subsequent year after the revenue jump, and their distribution in industries. If the best ones and worst ones are focused on outstanding industries, we will do further investigation.
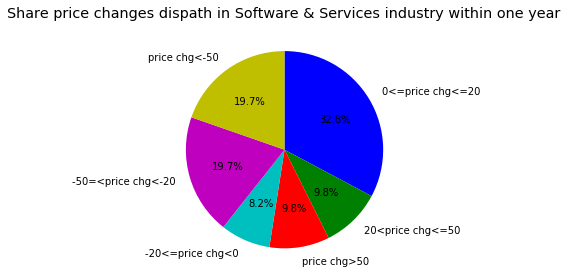
I would use the mean price of adjusted closed price in the two years based on weekly share prices to make a comparison, then divide the price changes into 6 categories: price change more than 0 but less than 20%, price change between 20% and 50%, more than 50%, less than 0 but greater than -20%, between -50% and -20%, falling down more than 50%.
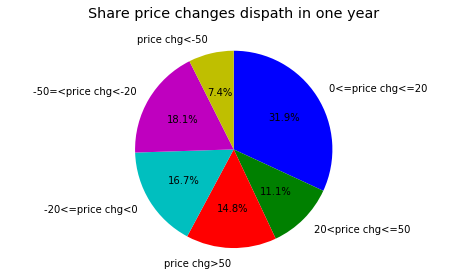
At the first glance, we can see we are more likely to earn profit in this way, much more probably to obtain profit between 0 to 20%.
Everyone want to earn the most from market, so next, I would like to know where those companies, whose share price jumped more than 50% in one year, are belonging to which industries, so we know it has more chance in those industries.
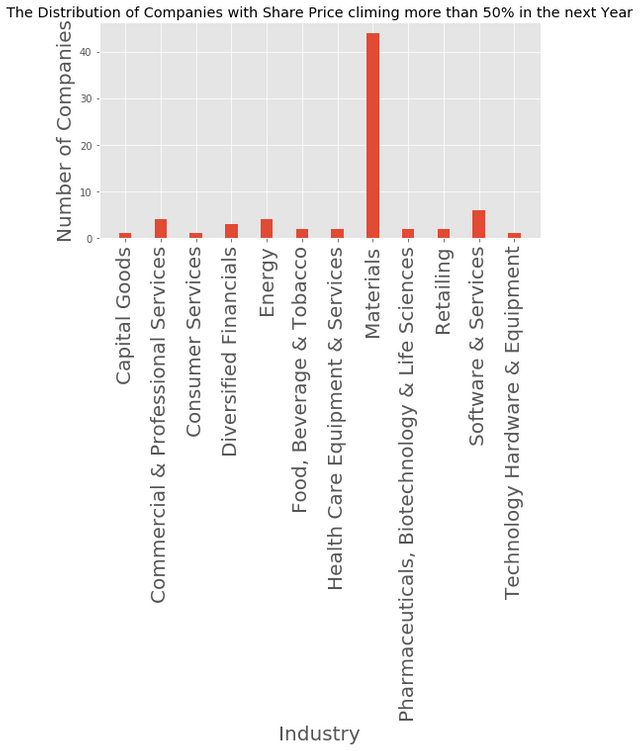
As we can see, 'materials' and 'software & services' top them all. Wait, maybe it is due to ASX has too much listed companies in the domain of materials and software & services. So let's go on to see how about those worst performance companies belong to. Let's take a look at what industries those companies belong to with worst share price performance:
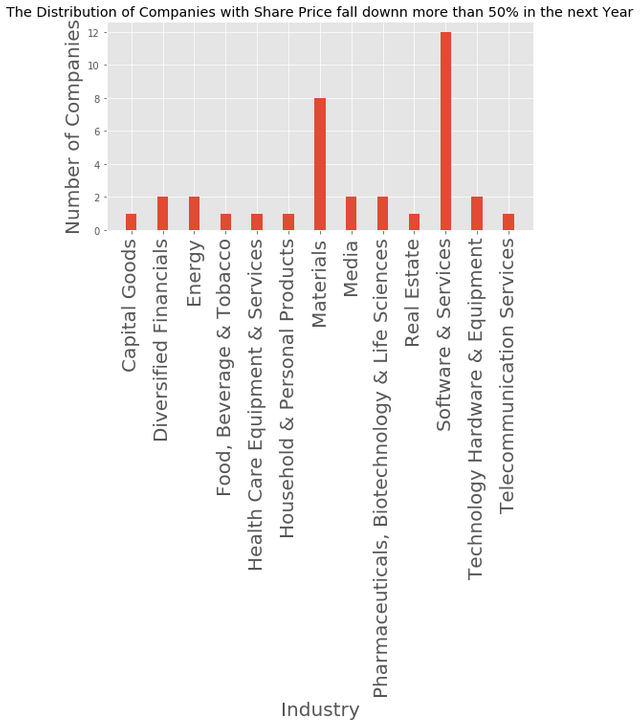
Yes, within my expectation, those worst share price performance companies are located in the same domain, materials and software & services. So in my next post, I would use percentage of companies in their own industries as a metrics instead of using absolute quantity of companies.
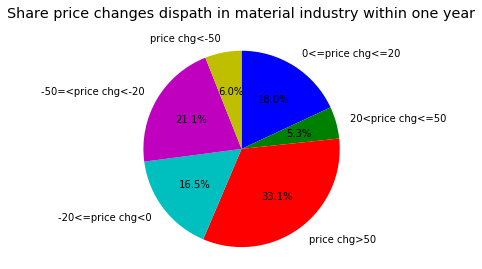
As the industries of material and software & services are so outstanding, I would to draw pie charts to show the distribution of companies within their own industry with different share price performance.
Let's also take a look at share price performance in the industry of software & services.
To be honest, if I want to invest to some companies, these are still not enough to give me sufficient clues. In the next post, I would like to dig more into these data to use percentage of companies in their own industries so it might make more sense. In addition, these analysis didn't ask me such questions: why rocket of income, healthy balance sheet, good cash flow won't always push share price up? I have some assumptions which need further data analysis:
- maybe the share price on the year had already overact to the coming good news of revenue boom;
- maybe the revenue increment is unsustainable in the year after;
- maybe people don't believe the good revenue performance would last long.
You can also get my latest python script from the github below:
nice post.upvote and comment on my posts i will do same regularly.
Nice read. I leave an upvote for this article thumbsup