TIB: Today I Bought (and Sold) - An Investors Journal #223 - Oil Pipelines, Oil Services Technology, Europe Oil Producers, Europe
More campaign promises get delivered by Mr Trump - Iran this time. Oil prices keep on moving and a few pending orders are hit in oil services, in major oil producers and in oil pipelines. The US Dollar moves also continue with JP Morgan talking up US yields. This is creating a quandary for emerging markets investing.
Portfolio News
Iran Sanctions President Trump broke ranks with USA's allies and announced that he will withdraw the US from the Iran nuclear agreement saying the deal was "decaying and rotten".
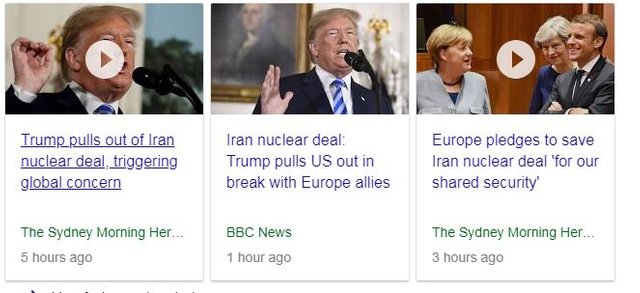
Reaction was immediate with the Iranian President saying that he has ordered the Iranian Atomic Energy agency to be ready to act when needed to restart the program. He did say he would consult with other signatories to test if the deal could stay in place with their support.
European leaders regretted the decision and said they would work with Iran somehow.
President Donald Trump’s decision to re-impose sanctions on Iran threatens to tighten global oil markets and could derail tens of billions of dollars in business deals
Sanctions come in 3 waves
- Immediatelty: No new contracts
- August: Holdings of Iran sovereign debt or currency and trade in gold and other precious metals, graphite and coal, metals such as aluminum and steel, the country’s automobile sector and luxury products such as Iranian-origin carpets and caviar.
- November: business with Iran’s oil industry and trading with Iranian oil entities.
Biggest casualties will be aircraft orders for Boeing (BA).
Emerging Markets Rout It started in emerging markets currencies as the US Dollar strenghtened. It was exaggerated when Argentina took action to protect its currency by raising interest rates dramatically. What really is going on?
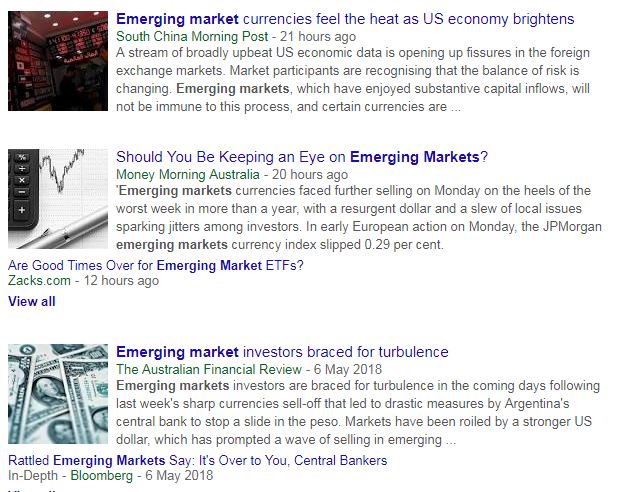
Investors have been scrabbling around the world for some time looking for higher yields to counter low interest rates in US and Europe. Emerging markets debt has been a good way to do this. With growing economies, the actual risk is not as bad as is commonly perceived. Two factors are beginning to move which makes this pretty uncomfortable. US yields are rising in real terms which makes US bonds look relatively more attractive with lower perceived risk. And the US Dollar is getting stronger which is diluting the gains made by being in emerging markets currency denominated bonds. The result is emerging market bonds are sliding and dragging emerging markets stocks along with them.
A stream of broadly upbeat US economic data is opening up fissures in the foreign exchange markets. Market participants are recognising that the balance of risk is changing. Emerging markets, which have enjoyed substantive capital inflows, will not be immune to this process, and certain currencies are already feeling the heat
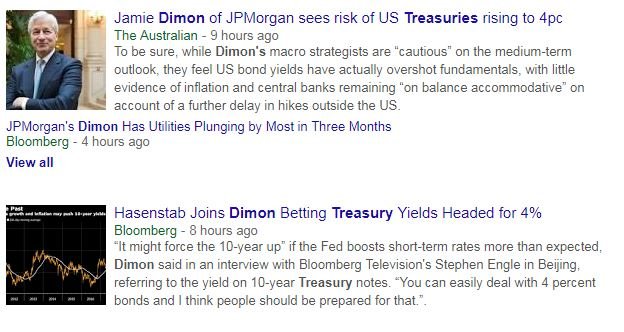
Now this is not helped when the head of JP Morgan starts talking up the potential of 4% yields on US 10 year Treasuries
This is pretty frustrating for an equity investor as the GDP growth data is still strongly supportive of growing equity values in many emerging markets - the top 15 (major) economies are all growing in excess of 3.5% year-on-year compared to US's 2.9% and Sweden the next best in Europe at 3.3%.
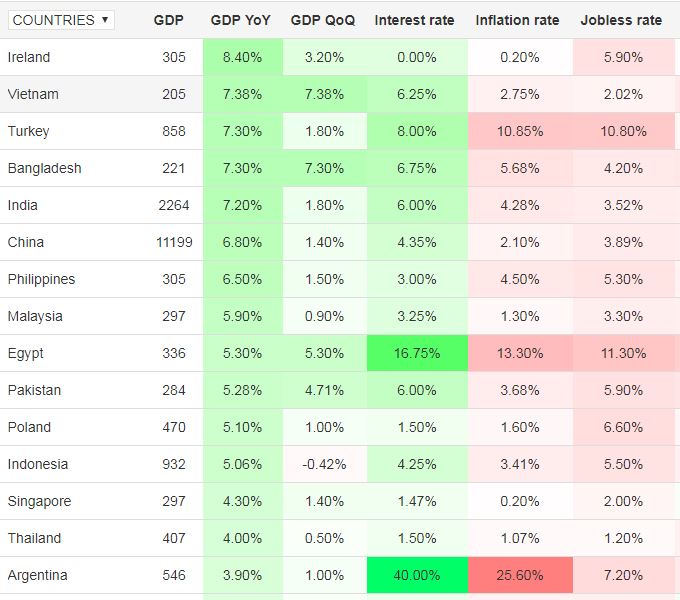
One of the talking heads suggested that investors need to be careful of not throwing the baby out with the bath water. I must say I am in two minds here as I have extensive investments across all the markets except Ireland and Bangladesh and it is hard to see hard won gains disappear as investors who do not dig into the detailed numbers hit the panic button.
Bought
Emerge Energy Services LP (EMES): US Shale Oil Technology. EMES has two oil services businesses - one is a sand business used for fraccing and the other is a fuel terminal business. I bought my first holding in February 2017 as a way to dig one level deeper into the oil services industry. I presented a buy:sell chart in TIB29 showing how EMES was outperforming the oil services sector as a whole.
Here is a newly updated chart which shows that EMES has been drifting slowly lower during 2017 and has been going sideways since then.
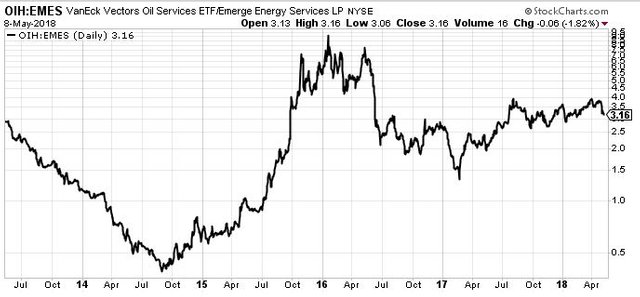
On a buy:sell chart, the first named stock is outperforming when the chart goes up. With oil price holding over $65 for a while now, I will not be surprised to see EMES resume its out-performance. I added another small parcel to a position which is still below standard size for the portfolio
Enable Midstream Partners, LP (ENBL): US Oil Pipeline. I wrote about oil pipelines in TIB219. I added another small parcel of ENBL to average down my entry price. Here is the new chart.
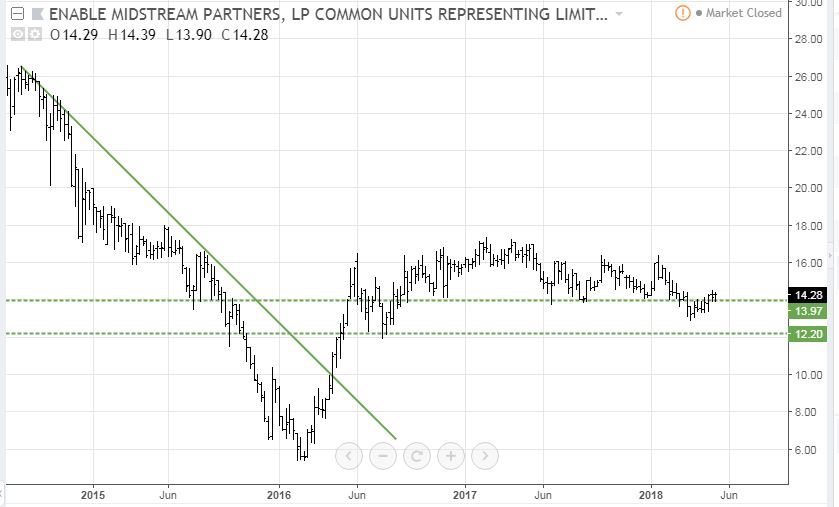
This is one of those frustrating breakout charts. Price did break the downtrend decisively in early 2016 and then started trading sideways and then drifting downwards making a lower low a few weeks ago. I am looking for this to hold above the upper support line backed by a higher oil price. Getting halfway to the 2014 highs will make for a 50% trade.
Royal Dutch Shell plc (RDSA.AS): European Oil Producer. Partial fill on December 2021 strike 32 call options placed on May 7. See TIB222 for the discussion.
Sold
iShares Europe ETF (IEU.AX): Europe Index. One of the challenges of investing in Australian resource stocks is holding capital ready to fund share purchase plans (SPP). There are a number of SPP's coming up especially in US oil shale producers listed on the ASX. I sold a parcel of shares to fund the upcoming SPP's for 21% profit since May 2014 and January 2015. Nobody was buying shares in Europe so soon after the European Debt Crisis.
Cryptocurency
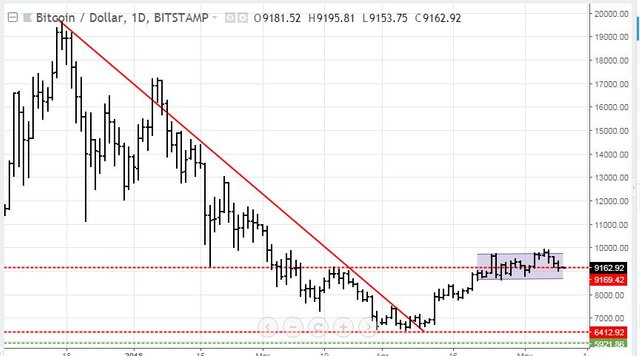
Bitcoin (BTCUSD): Price range for the day was $435 (4.6% of the high) for another quiet day. Price did close above the support line I drew a few days ago.
I did resist the urge to add more trading positions. I am well enough exposed.
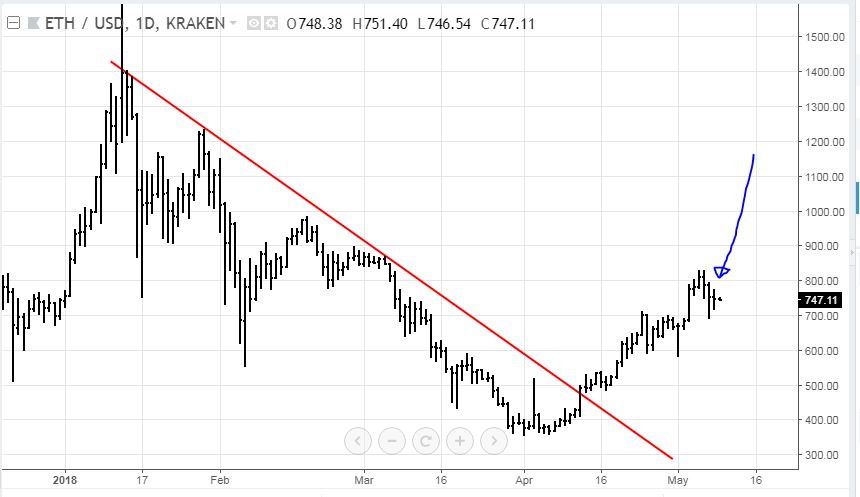
Ethereum chart has me more interested with an inside bar for the day. [Means: Price was fully contained by the high and low of the previous day]
CryptoBots
Outsourced Bot One closed trade on this account - ENG (1.74%) replaced with a trade on TRX which is currently positive (197 closed trades). Problem children (>10% down) list was increased by one with XMR joining at -11% - (14 coins) - ETH, ZEC, DASH, ADA, PPT, DGD, ENG, GAS, NEO, ETC, QTUM, ARK, BTG, XMR.
Yesterday's post double counted ADA. Note that this robot holds multiple positions as it is operating as a set of robots under one umbrella account
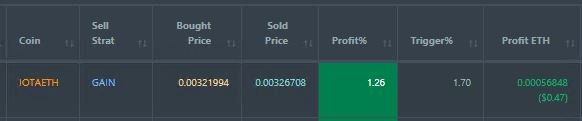
Profit Trailer Bot Overall the bot closed 1 trade for a profit of 1.26% bringing overall loss on 218 closed trades to -0.52% (was 0.53%) of total balance.
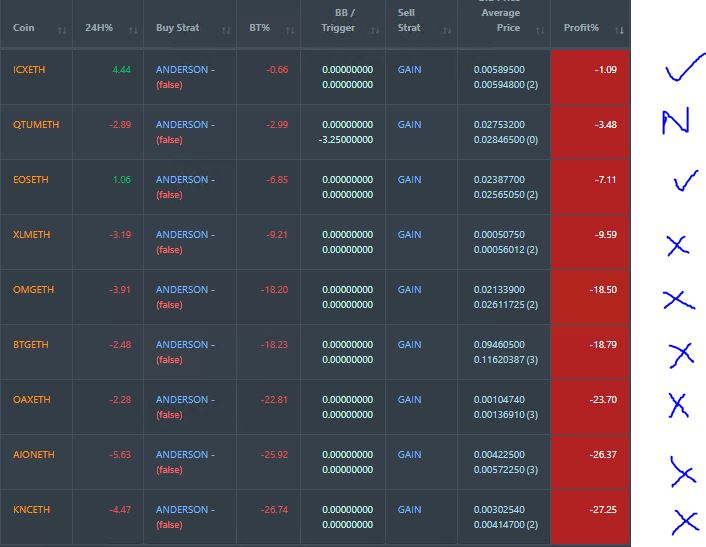
Dollar Cost Average (DCA) list was increased by one with QTUM joining the list. With Ethereum price recovering it is no surprise to see 6 out of the 9 falling and only 2 improving. This is an ugly list - though the exposures are modest.
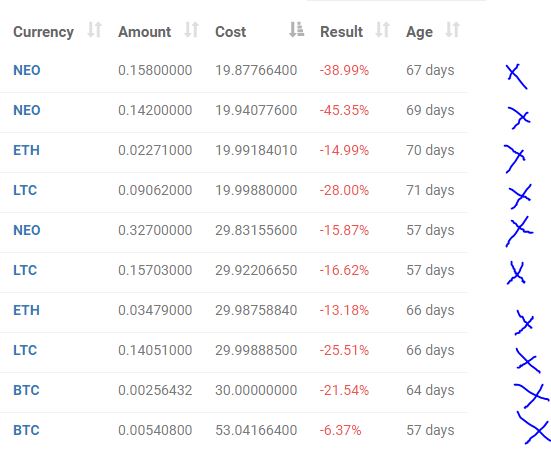
New Trading Bot Positions worsened to 19.9% (was 17.5%)
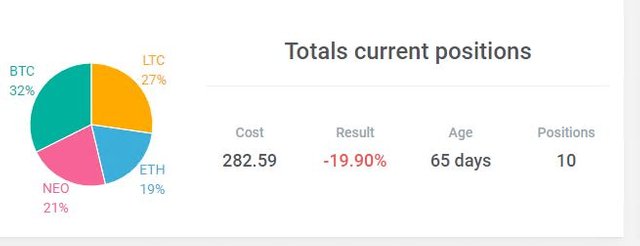
NEO continues to be the worst performer though LTC dropped more in percentage terms on the day.
Currency Trades
Forex Robot did not close any trades and is trading at a negative equity level of 18.2% (higher than prior day's 16.3%). Inching ahead gave way to falling back a foot.
Outsourced MAM account Actions to Wealth closed out 2 trades for 0.26% profits for the day.
Cautions: This is not financial advice. You need to consider your own financial position and take your own advice before you follow any of my ideas
Images: I own the rights to use and edit the Buy Sell image. News headlines come from Google Search. GDP image comes from tradingeconomics.com. All other images are created using my various trading and charting platforms. They are all my own work
Tickers: I monitor my portfolios using Yahoo Finance. The ticker symbols used are Yahoo Finance tickers
Charts: http://mymark.mx/TradingView - this is a free charting package. I have a Pro subscription to get access to real time forex prices
Bitcoin: Get started with mining Bitcoin for as little as $25 http://mymark.mx/Galaxy
May 8, 2018
Interesting cartoon by Steve Sack - a News Item that says " More structures destroyed as Killatreaty volcano continues oozing destructive magma." As usual useful information.
I found it embedded in this video from France24
https://fr.news.yahoo.com/trump-et-liran-aux-etats-054534289.html?guccounter=1
Upvoted ($0.12) and resteemed by @investorsclub
Join the Investors Club if you are interested in investing.
a very useful program,i agree with you,i really support the program,thank you for sharing,@carrinm
Very enlightening science and experience that you describe. thank you for sharing😍😍
@carrinm your post is nice my btother
My brother @carrinm, can i ask a small question which up to now I am still confused.
Why is the oil problem always associated with fluctuations in currency prices, especially the US dollar?
thanks so much brother.
Oil is priced in US Dollars worldwide. That means that changes in the relative value of the US Dollar will change the price of oil without any change in the supply and demand for oil.
Investing in oil though is best based on understanding supply and demand for oil and the costs of producing oil independently of what the US Dollar is doing.
I understood now. You are indeed an analyst. thanks so much Mr. @carrinm. nice meet you