TIB: Today I Bought (and Sold) - An Investors Journal #230 - US Oil Producers, Semiconductors, Apparel, Oil Services, US Dollar, Ethereum
Oil prices keep rising. I add to Chesapeake positions using options. Steph Curry is good for Under Armour. Who is he anyway? More work on Qualcom long term options. Ethereum grabs my eye.

Portfolio News
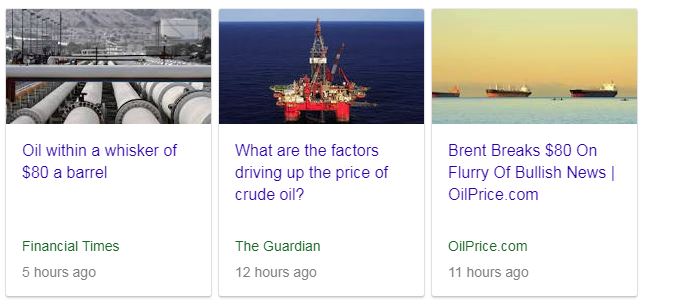
Oil Price Brent crude oil price topped $80 per barrel for the first time since 2014.
There are supply problems emerging in Venezuela and in Angola to add to the potential for loss of supply from Iran with re-imposed US sanctions. US inventories are also declining and the only place for supply to ramp up short term is US Shale and Saudi Arabia. It is not in Saudi interests to ramp up supply just yet.
The challenging question is going to be at what point does the high price begin to crimp demand? I am betting it is a way off as economies continue to grow. I am investing that way
https://oilprice.com/Energy/Oil-Prices/Brent-Breaks-80-On-Flurry-Of-Bullish-News.html
Oil price rise did push energy stocks up (nice). The increase in Treasury yields did take the shine off the US sessions. What was noticeable is Russell 2000 (an index of small cap stocks) did make a new high. This tells me that the economic growth drivers are still in place
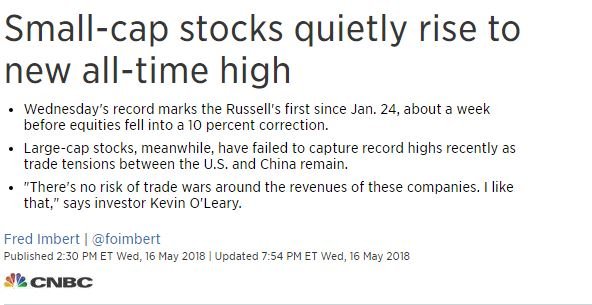
https://www.cnbc.com/2018/05/16/small-cap-stocks-quietly-rise-to-new-all-time-high.html
Bought
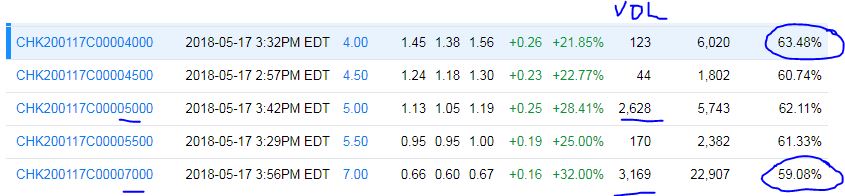
Chesapeake Energy Corporation (CHK): US Oil Provider. Consistent with my strategy on adding US shale oil, I explored options trades to add to the holdings I bought in Chesapeake on May 11 (see TIB226 for the rationale then). Options are expensive. A January 2020 strike 5 call option was priced at $1.33 premium. Prior day close was $3.95 which implies a 35% price movement needed to pass breakeven. I remain convinced about the stock idea (that is why I bought it). I looked at options closer in in time and I looked at bull call spreads. There are only strike 7's with bids offered. I bought a January 2020 4/7 bull call spread for a net premium of $0.80. [Means: Bought strike 4 call options and sold strike 7 call options with the same expiry]. Breakeven is now $4.80 (21% from close) and maximum profit potential is 275% if price gets to $7 at or before expiry.
You may think this is a "barking mad" trade. It gets worse. In my small portfolio, I bought the same spread and I bought the stock. My broker does not allow that account to sell call options without owning the stock. I notice this morning that price closed at $4.29 which is an 8% jump in one session. That jump increased the value of the stock I bought last week by more than the cost of the two spreads.
What else tells me this is not barking mad? Volume on the strike 5 and strike 7 call options was very high with over 2500 contracts traded on each. The 5/7 bull call spread offers a maximum profit of 325% if price passes 7.
How does this look on the charts which shows the bought call (4) as a blue ray and the sold call (7) as a red ray with the expiry date the dotted green line on the right margin.
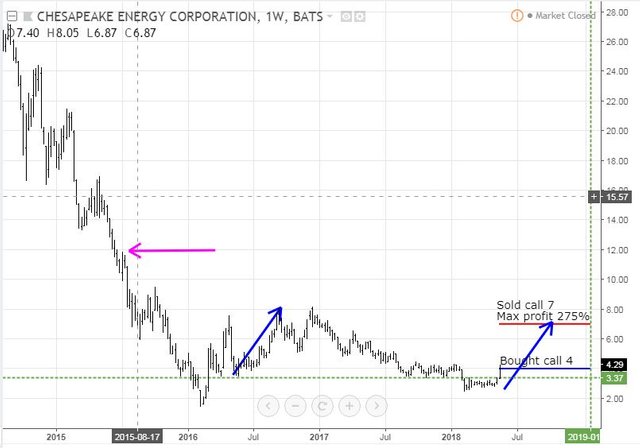
There is a lot to like about the chart. Price has broken above the resistance line (dotted green horizontal line). Maximum profit is below the level of the late 2016 highs. Target price is well below the industry benchmark I plotted last time (the pink arrow). The last time price moved out of a consolidation zone (left hand blue arrow), it did enough to make this a winning trade - the consolidation can run a few more months too. This is the main reason I bought the stock last week (up 27% since then) and was happy to buy it again this week.
There was another stock that was on the price to book valuation screens, Nabors Industries (NBR). Its options are also expensive with implied volatility a little cheaper (52% vs 63% for in-the-money) than Chesapeake but with a higher stock price ($8.61 closing). A 7/12 spread has profit potential of 177% and 10/15 is 313%. How does its chart look?
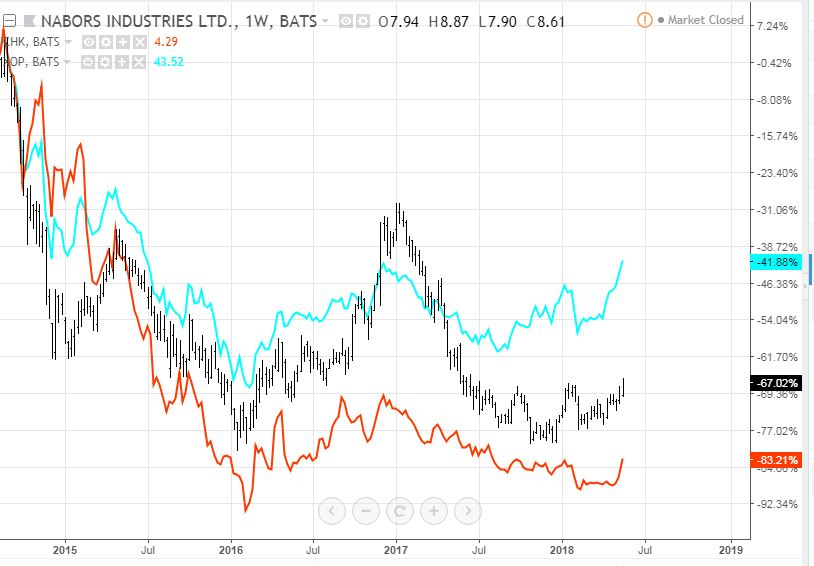
I have plotted Nabors (black bars) against Chesapeake (orange line) and Oil Producers ETF (XOP - blue line). What I like about the Nabors chart is it had a bigger spike to the 2016 highs which tells me more may be attainable, though it has a smaller gap to make up to the industry.
QUALCOMM Incorporated (QCOM): US Semiconductors. I had a good look at bull call spreads further out in time than the trades I made earlier this week. My bids on a 55/67.5 spread were not taken up as price moved passed the 55 strike level. I was not totally comfortable going past the top of the recent highs say to a 70 sold call. I bought a January 2020 57.5/67.5 bull call spread for a new premium of $3.94. Maximum profit potential is a modest 153%
The chart tells its own story. All that price has to do is go back to where it has been (twice since 2016) to make the maximum profit.
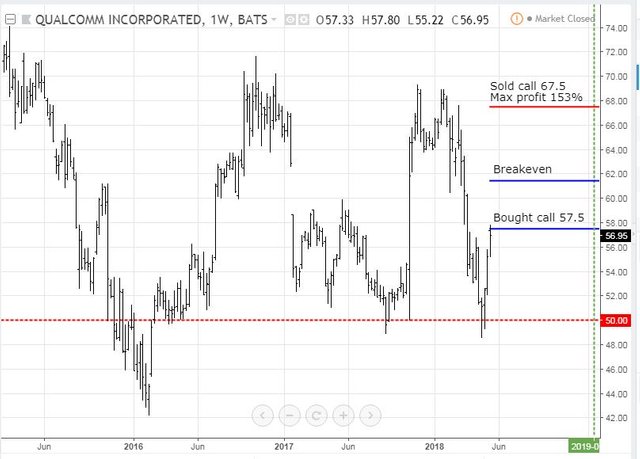
I am comfortable that smartphone usage will continue to grow with economic growth in the 19 months left to run. The Russell 2000 move tells me that.
Under Armour, Inc (UAA): Apparel Manufacturing. Under Armour has appeared on my stock selection screens for all the wrong reasons. It has been cycling down steadily in a long decline since the 2015 highs. Results reported on May 1 were underwhelming with high inventory levels a problem. The screens have been all about trading the short term continuation of the downtrend. Up it popped on the talking heads show last night with a spike in price in early trading seemingly all on the back of new product launch information - who is Steph Curry anyway?
I am always looking for stocks that make a new high against the trend - that was enough for me to have a look at options chains. I bought a January 2020 20/30 bull call spread for a net premium of $2.70. Maximum profit potential if price reaches $30 on or before expiry is 270%.
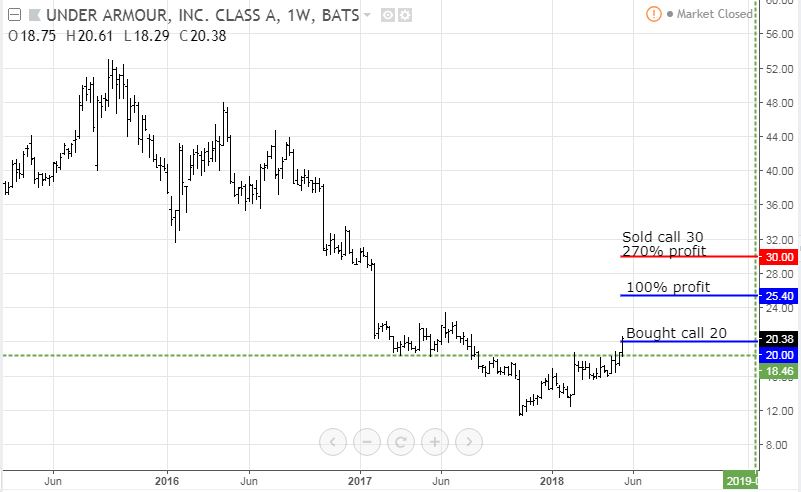
The chart is straight forward. Price has been smashed since 2015 highs. It has broken through the resistance level (dotted green horizontal line). Reaching maximum profit is less than half way to 2016 highs and we know that the world economies are growing better now than they were then.
Now that I dig around looking for the back story I find a talking head talked this morning on my favourite show, Fast Money on CNBC about the break - he is a buyer. Thanks to Robert Sluymer, Fundstrat Global Advisors, for confirming my thinking.
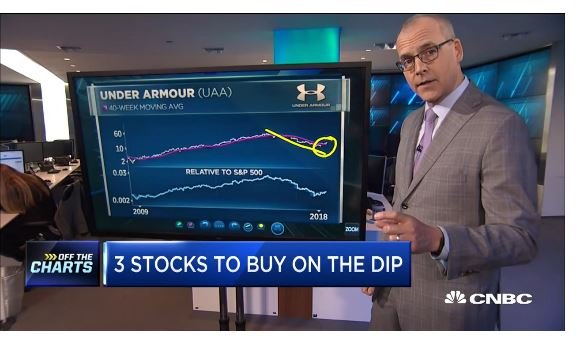
https://www.cnbc.com/video/2018/05/15/these-are-the-three-stocks-to-buy-on-the-dip-technician.html
Maybe this is what all the buzz is about?
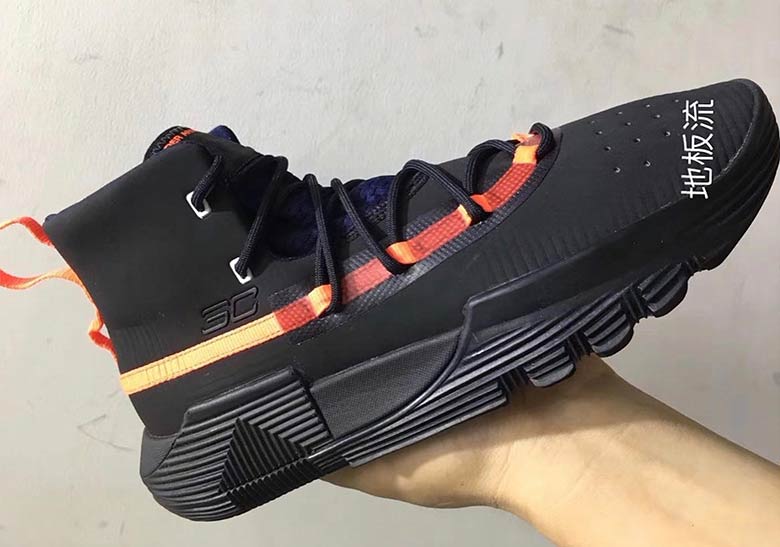
IMAGE CREDIT Instagram @SNEAKERHIGHWAY23
https://sneakernews.com/2018/05/16/under-armour-steph-curry-sample-first-look/
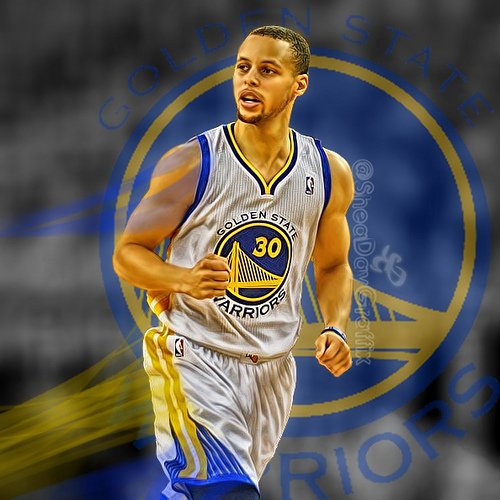
BTW: Steph Curry plays basketbasll for Golden State Warriors. Read about him here.
https://nypost.com/2018/05/17/the-warriors-need-the-real-steph-curry-now/
Sold
Halliburton Co (HAL): US Oil Services. Sold small parcel at recent highs (less than 100 shares) to close holding for a 28% profit since July 2015. This was a tidy up transaction and does not reflect my view on US Oil Services
Cryptocurency
Bitcoin (BTCUSD): Price range for the day was $520 (6.1% of the high) in a down day. Price basically headed down all day and seems to be seeking out the support lines at the bottom of "no mans land". I did think about adding another position and decided I have enough exposure for now.
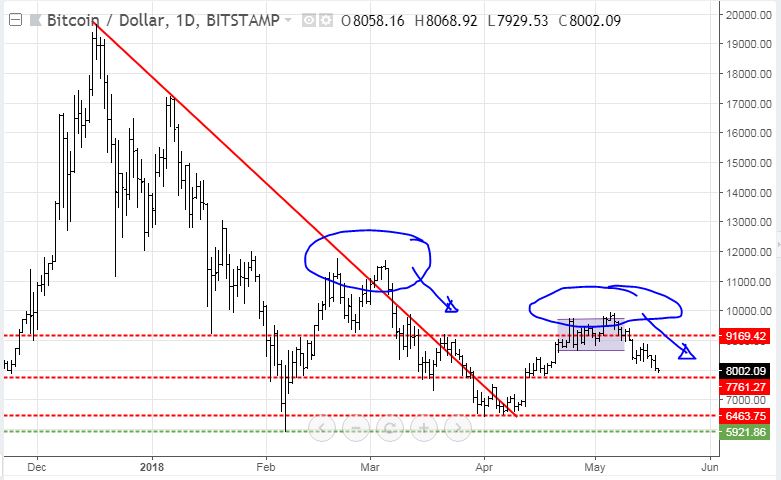
My concern from the chart is the risk of a repeating pattern. On the February run up, price made two goes at $12000 and failed and came back all the way to the lows (bottom dotted red line). This last run up has also had two goes at $10,000 and failed. If support does not hold at the bottom of no mans land (middle red line), we could see the pattern repeat.
Ethereum (ETHUSD): I did have a look at Ethereum charts on IG markets and noticed that spreads are quite a lot tighter than they offer on Bitcoin. I added one new contract on a 4 hour reversal - it feels like it has become falling knife trade.
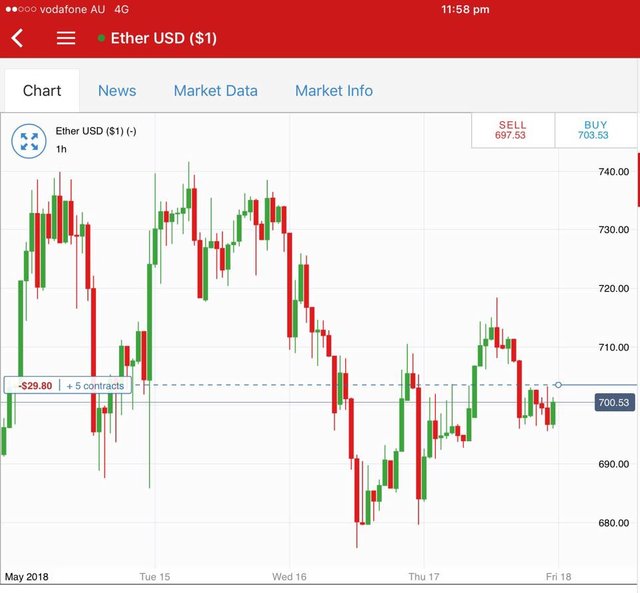
What I liked is price has made a series of higher highs and higher lows (1 hourly, 4 hourly, Daily)
CryptoBots
Outsourced Bot One closed trade on this account - EOS (1.95%) (204 closed trades). Problem children was unchanged (>10% down) - (13 coins) - ETH, ZEC, DASH, ADA, PPT, DGD, GAS (-45%), STRAT, NEO (-45%), ETC (-40%), QTUM, BTG (-41%), XMR.
BTG did join the -40% club. NEO remains the worst coin at -45%
Profit Trailer Bot The bot did not close any trades. The Dollar Cost Average (DCA) list stayed at 12 with 4 coins (EOS, OMG, OAX, KNC) trading flat.
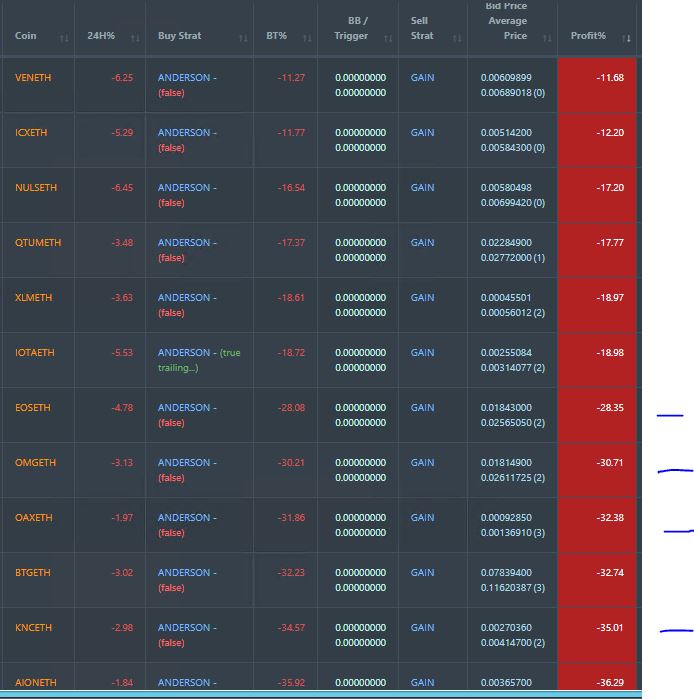
The sick state is getting worse and we do need to see a strong move upwards in BTC and ETH prices before this fixes itself. Apart from the pump and dump coins (OAX and KNC) these are solid coins.
New Trading Bot Positions dropped sharply to -33.0% (was -29.0%).
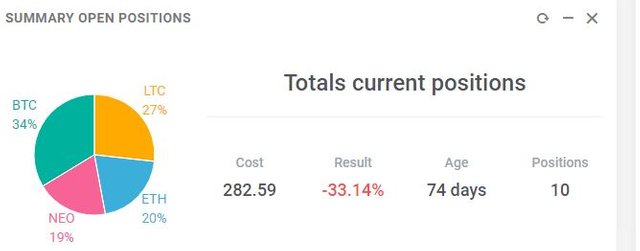
All coins traded worse with one NEO position approaching -60% down. I am sure happy I committed a small amount to this trial.
Currency Trades
I was doing tax accounting on my forex trading accounts. This meant I had to open the trading platform. I could not resist the urge to put on two currency trades. Maybe not a smart move.
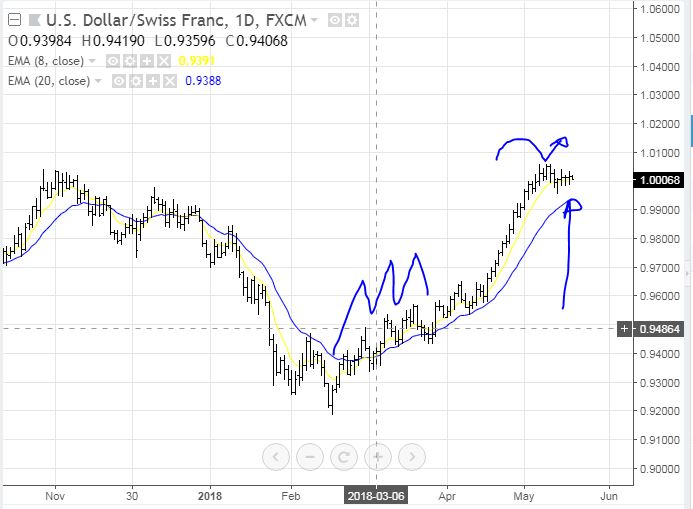
Swiss Franc (USDCHF): Fundamental view is US Dollar has been strengthening. The trade idea is simple on a daily chart. Wait for price to cycle back to the moving average and trade with the direction of the cycles. The challenge here is price might have exhausted itself
Canadian Dollar (CADCHF): Fundamental view is Canadian Dollar normally goes up when oil goes up. I saw a trade signal for a crossing over of a momentum indicator and a supporting signal from the trading coach. I opened a long CADCHF position. The morning review tells me the momentum indicator was in the wrong part of the chart = rusty trading.
Forex Robot did not close any trades and is trading at a negative equity level of 21.8% (lower than prior day's 22.1%).
Outsourced MAM account Actions to Wealth closed out 4 trades for 0.4% loss for the day. This was New Zealand Budget day. I would not have been trading.
Cautions: This is not financial advice. You need to consider your own financial position and take your own advice before you follow any of my ideas
Images: I own the rights to use and edit the Buy Sell image. News headlines come from Google Search and CNBC. Steph Curry/Sneaker images are credited below the images. All other images are created using my various trading and charting platforms. They are all my own work
Tickers: I monitor my portfolios using Yahoo Finance. The ticker symbols used are Yahoo Finance tickers
Charts: http://mymark.mx/TradingView - this is a free charting package. I have a Pro subscription to get access to real time forex prices
Crypto Trading: get 6 months free trades with Bitmex for leveraged crypto trading. http://mymark.mx/Bitmex
Bitcoin: Get started with mining Bitcoin for as little as $25 http://mymark.mx/Galaxy
May 17, 2018
Sweet calculations my friend, I will miss always your next posting @carrinm 😉
I've done a nice upvote boost to your post this week, happy to have a friend !!
The useful information and programs you do is very important for me to try better again and I am very glad to see you always share about this @carrinm ... resteem.
I agree with your oil plays..I bought leap call options on USO last week. Interesting play on UA...and I agree I think the bottom is in.
I have written about oil quite a bit - see TIB 139, 184 and 222. I just made this chart to look also at USO (black bars). It is supposed to track oil futures but it has traded with a gap lower since 2016 and the gap is widening (CL1 Futures - blue line). Top of the stack are integrated producers (Chevron - top line). Bottom of the pack is Chesapeake (bottom line). Notice that it turned after the oil price turned up. The industry ETF (XOP which is equal weighted - red line) also lags the oil price. I have left Nabors in (NBR - green line). I do not know what drove the spike in 2016 but it would create for some momentum if it happened again.
I notice that implied volatility on USO is low which makes for less scary investing
Great analysis, thanks.
Upvoted ($0.20) and resteemed by @investorsclub
Join the Investors Club if you are interested in investing.
amazing. Incredible oil business program @carrinm
I liked it. Maybe it is time to write a little about asset allocation. How much do I have invested in oil? I do not know.
Hopefully with this oil program you can succeed father @carrinm.
Right on the money again! Had the opportunity to listen to a Harvard Econ PHD today and he shared you exact thoughts about oil.
Cool. It is not often that investors and economists are on the same page.
am Venezuelan and the low demand for oil in my country is due to the economic blockade that established the United States to Venezuela.
United States was the number one consumer of Venezuelan oil, for the economic blockade. the president nicolas maduro ordered not supply more oil to the United States until it lifted its economic blockade against Venezuela.
Currently, Venezuela sells oil at a price given to Russia and China.
The oil business is fantastic, amazing @carrinm.
Resteem let others can see it @carrinm.
Thanks
both my brother @carrinm, I always support you and wish you success always.