TIB: Today I Bought (and Sold) - An Investors Journal #299 - French Utility, Swiss Interest Rates, Europe Interest Rates
Interest rates are on my mind as Swiss futures expire and are rolled over. Hurricane smashes the corn fields - ouch. And somebody liked my French utility trade idea - they sold it to me cheaply. Ethereum markets may have shaken the weak hands out

Portfolio News
Market Jitters - Tariff Tantrum Markets continue to diverge
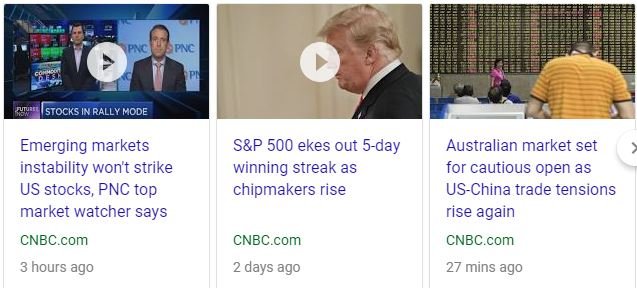
This is becoming something of a flip flop market as S&P500 ekes out gains for the week. Quite a few chip stocks bounced which seemed to buoy the markets. Advanced Micro Devices (AMD) in my portfolios went down 5% on Thursday and up 7% on Friday, for example. US markets shrugged off retail sales data that was a little softer than expected.
The talking heads are now all talking about the divergence between US and other markets.
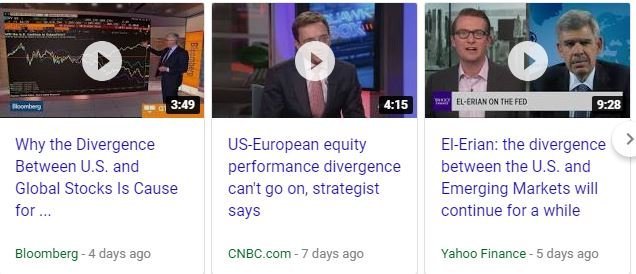
They are mostly comfortable that the economic engine in the US will keep driving earnings for the next 6 months and probably longer. They are much less comfortable about Europe and all emerging market economies that are exposed to the strong US Dollar. Some say it can keep on going and others say it cannot last - this is the land of talking heads. Watch the 3 videos and live the land of the talking heads
https://finance.yahoo.com/video/el-erian-divergence-between-u-213542331.html
I have long written about "Europe Muddles" as the European Central Bank has dragged its feet to reduce its quantitative easing program. It seems that the talking heads are thinking the same and this is the biggest contributor to the US Dollar staying stronger for longer. Who in their right mind would want to hold their December 2020 positions in Euros earning 0.3% when one can get 3% in US Dollars for 2019 positions?
The tariff story continues to dominate mindsets with China now saying they will not rejoin the trade talks if US persists with the head banging from Donald Trump about the $200 billion.
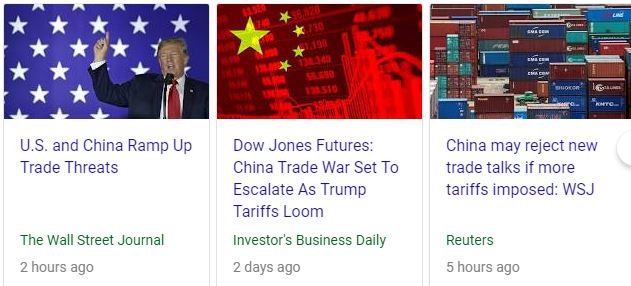
It seems that there is a mistrust building with the Chinese negotiators getting fed up with trade discussion ideas agreed with Steve Mnuchin, Secretary for the Treasury being vetoed by Trump. My read is I think the head banging will continue right into the heat of the mid term elections - it is the only way that Donald Trump knows.
Hurricane Florence It is hurricane season again says this chart
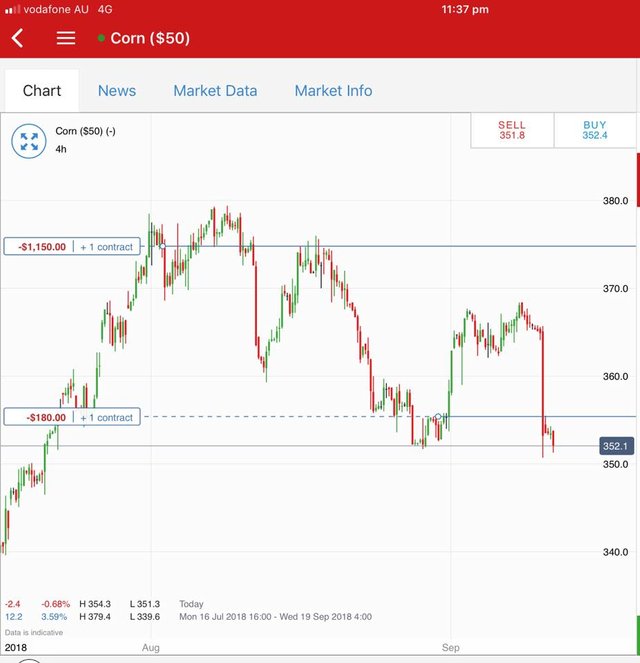
I have been meaning to post this chart from last week. It shows the anticipation of corn markets for the hurricane hitting the cornfields - a 5% drop in price in one 4 hour slot. If the corn crop was going to be wiped out in the storm, I would expect corn prices to rise as supply gets wiped out. I do know that prices for close in futures would get smashed but this is not one of the futures products - it is a CFD product. I am sure hoping my understanding of supply and demand economics flows through to market prices for corn once the hurricane news passes.
Bought
Electricité de France S.A (EDF.PA): French Utility. I put on a low ball bid of €0.95 (5.9% of strike) for December 2019 strike 16 call options to deploy a portion of the profits from the June 2019 strike call options which I sold a few weeks ago for a tidy profit. I did write in TIB296 that I was not totally convinced that price could reach the next strike up (€16) from a closing price just short of €15 (€14.57). The low ball bid is one way of testing out what other option writers feel. I have added the new contract to the chart all in pink (excuse the mess).
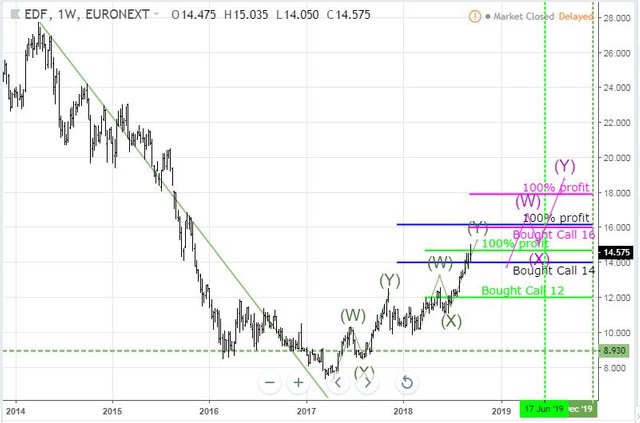
The chart shows the strike 12 call options that have just closed out in fluoro green. It also shows the strike 14 call options that I am holding in one portfolio in blue. The price scenario that I modelled (3 wave WXY move) has played out precisely as modelled to take the 12 strike calls past their 100% profit levels. I am clearly going to need a little more for the strike 14's and the new strike 16s to make 100%. The best part is price has not even reached halfway back to 2014 highs. So, I have cloned in another WXY wave after a period of consolidation - that should take the trade to 100% profit. Of course one could argue that price is following a Elliot Wave formation and is now in the 5th wave and price will not extend much beyond where it has already reached. If it is, wave 5 is now quite a bit longer than wave 3.
This is where fundamentals come into play. I know that EDF are in the middle of a multi-year transformation program. I know also that economic growth is moving along in its major markets progressively (so no problems on demand side). Results for 6 months to July 2018 show sales growing 5.6% and net income growing 27% which confirms to me that they are growing faster than their economies and also cutting costs. The details of the 2030 transformation program also show major advances in building the renewable side of generating capacity and fixing problems in the nuclear side of the business. They are also moving into new economic growth regions in Africa and building 6 nuclear power plants in India.
Shorts
Euroswiss 3 Month Interest Rate Futures (S) Maturity date for these futures is September 17. I decided to reduce my exposure so that only a few contracts would roll over automatically. In all 4 contracts were closed and 5 rolled for average 6.4 basis points loss and 5 contracts remain after rollover. Spreads for rollover were tighter than I expected (unlike the Japan Government Bonds rollover earlier in the week). The new contracts expire in December 2018. I will look to squeeze out a few basis points and then exit.
Euribor 3 Month Interest Rate Futures (IZ): I have been watching US interest rates closely over the last 10 days. Eurodollar price broke below the lows to position well above 3% yields.
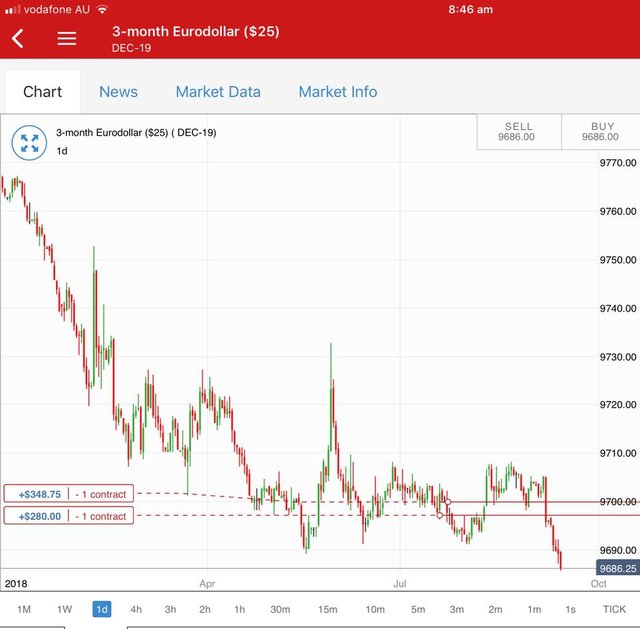
At the same time European rates have stubbornly refused to budge.
A quick lesson on reading the charts. It is a price chart centred on 10000 being a zero percent interest rate. Anything below 10000 is a positive rate - so 9700 is equivalent of 3% rate.
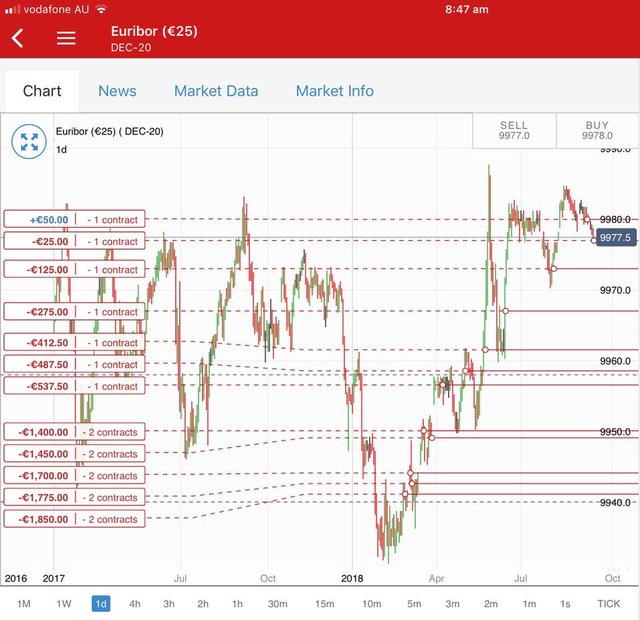
The crazy part is the Euribor rates are for one whole year longer (Dec 2020). I cannot see how rates can stay in Europe the way they are when US rates have already moved so strongly. I am standing behind my thinking and added another short on Euribor rates using margin released from Euroswiss futures. I am now short 17 contracts - all showing.
Income Trades
American International Group, Inc (AIG): US Insurance. Somehow the covered call I wrote for September was written on the weekly options rather than the monthly options. Price closed at $53.25 which was short of the 55 call written so I get to keep the 0.32% premium. Weekly calls does give an opportunity to write closer in than the normal 4 weeks away.
Cryptocurency
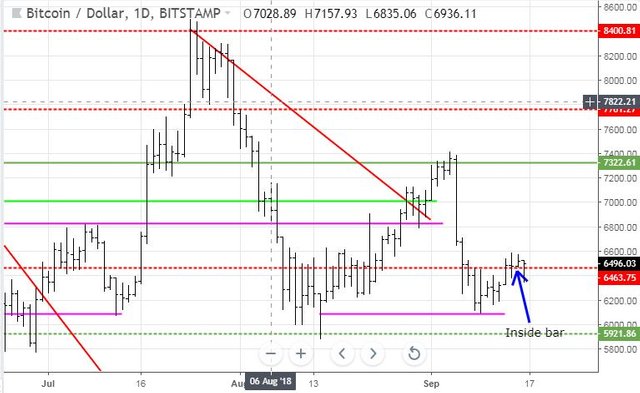
Bitcoin (BTCUSD): Price range for the weekend was $238 (3.6% of the high). Markets calmed down with price action very clear about being indecisive. Friday's (3rd bar back) open and close were about the same though price did swing a bit. Saturday was an inside bar and Sunday saw price test below the support line and come back to close pretty well where it started. This is good news building off the pink ray support line and making a higher high on the cycle.
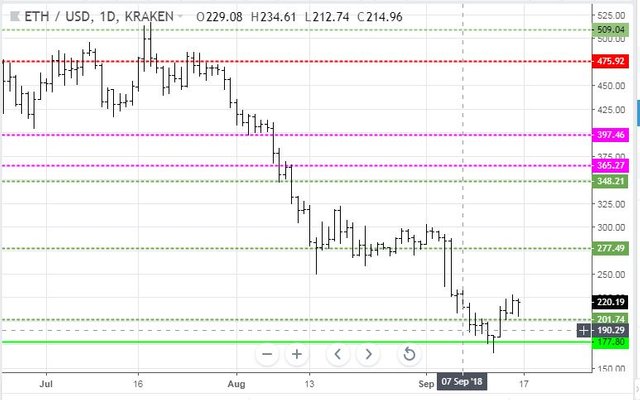
Ethereum (ETHUSD): Price range for the weekend was $25 (12.3% of the high). Price action for ETH looked more decisive with no inside bar on Saturday but a higher high. Sunday did see the low taken out but price did close where it opened. Volatility is nearly 4 times more than Bitcoin. I am always hesitant to make price predictions but this price action from the green fluoro bottom feels like the weak hands have been shaken out.
CryptoBots
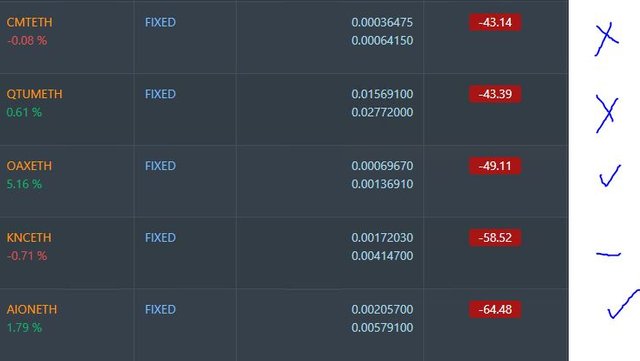
Outsourced Bot No closed trades. (221 closed trades). Problem children stayed at 18 coins. (>10% down) - ETH (-67%), ZEC (-66%), DASH (-60%), LTC (-48%), BTS (-43%), ICX (-79%), ADA (-73%), PPT (-79%), DGD (-83%), GAS (-83%), SNT (-61%), STRAT (-75%), NEO (-79%), ETC (-52%), QTUM (-79%), BTG (-72%), XMR (-34%), OMG (-67%).
A flip flop period with most coins going up and down in a 1 or 2 point range. LTC (-48%), BTS (-43%), and PPT (-79%) all improved a level with BTS improving 8 points. DGD (-83%) and GAS (-83%) are equal worst. After opening up one bot last week, there is a clear strategy lesson for trading. The bot made 8 winning consecutive trades averaging 2.42% profit (16.91% cumulative) and has been left with one open trade which is now -17% down. A stop loss strategy of say 7.5% would leave the bot up by 9 points and still trading. I cannot put in a stop loss on the account because of the large number of open trades that would be stopped out.
This is what trials are for - test out ideas with a small amount of capital and track the results.
Profit Trailer Bot Four closed trades (1.65% profit) bringing the position on the account to 2.53% profit (was 2.43%) (not accounting for open trades). LTC sale included 2 levels of DCA.
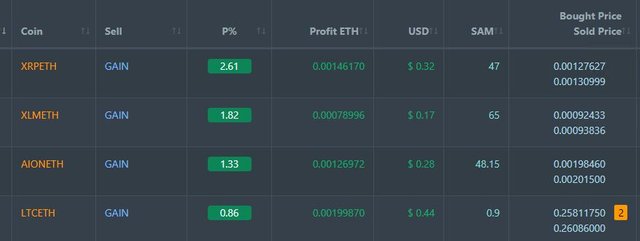
Dollar Cost Average (DCA) dropped to 3 coins with LTC closing for profit. 2 coins have completed one level of DCA (ZIL and ETC) and 1 coin (ADA) has done 2.
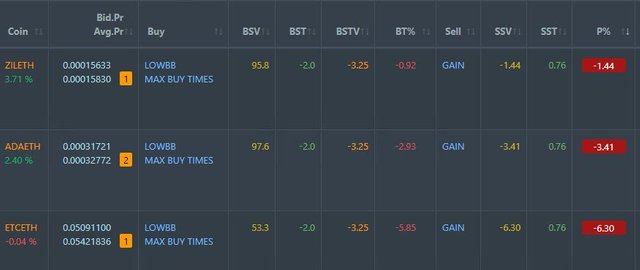
I thought I had set the bot not do DCA purchases - I worked out what was wrong - I had set max buys to zero thinking that is what it would mean. What that does is reset to default which is to buy as many times as price trigger is met - that is why ADA has 2. I set it back to 1 and will live with that for now.
Pending list remains at 10 coins with 3 coins improving, 2 coins trading flat and 5 worse.
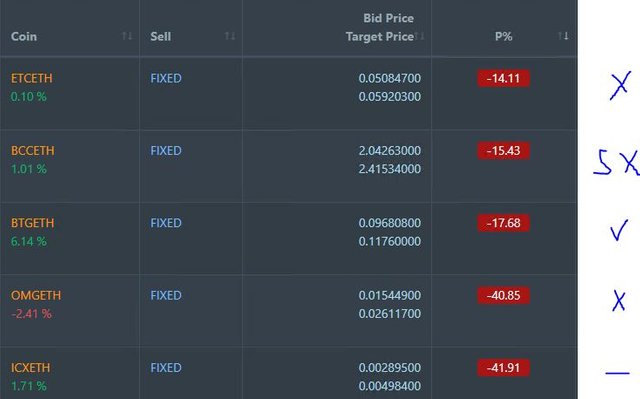
PT Defender continues defending 6 coins and is waiting for ETC to sell from the DCA list. The remainder are waiting for buy signals.
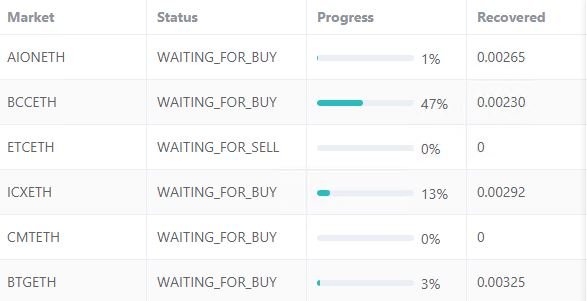
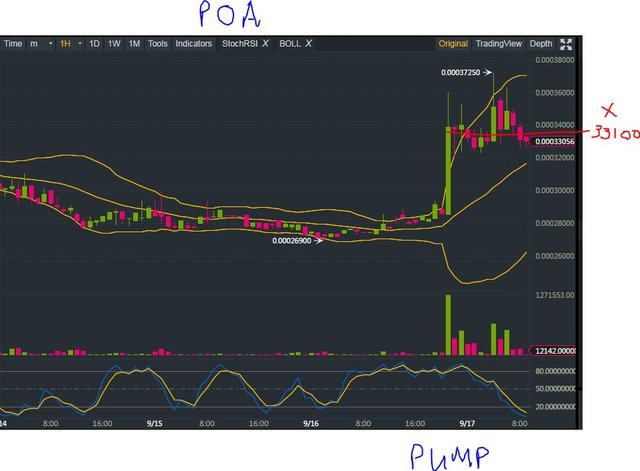
New Trading Bot Trading out using Crypto Prophecy. A pump and dump took out target on POAETH which has been standing since I closed half trade for profit on September 1. I just wanted to exit and hold the profits I had made. The chart tells me I could have got more BUT an open trade locks up capital.
Trades on TRX, SNT and DGD remain open and under water. SNT has also had a pump which topped out just below my sell order. DGD has also been pumped but is nowhere near my sell order.
Currency Trades
Forex Robot did not close any trades and is trading at a negative equity level of 24.4% (higher than prior day's 21.4%).
Cautions: This is not financial advice. You need to consider your own financial position and take your own advice before you follow any of my ideas
Images: I own the rights to use and edit the Buy Sell image. News headlines come from Google Search. All other images are created using my various trading and charting platforms. They are all my own work
Tickers: I monitor my portfolios using Yahoo Finance. The ticker symbols used are Yahoo Finance tickers
Charts: http://mymark.mx/TradingView - this is a free charting package. I have a Pro subscription to get access to real time forex prices
Crypto Prophecy provides a useful tool to identify oversold and overbought coins - https://mymark.mx/CryptoProphecy
September 14, 2018
ETH definitely looked and felt like capitulation given price movement and volumes surpasses those of the past year. I would have hoped the rest of the market followed to capitulate as on the contrary, further weakness could spread the contagion lower if it happens again.