TIB: Today I Bought (and Sold) - An Investors Journal #328 - US Retail, Nasdaq, Europe, Bitcoin, Gold Exploration
Stocks bounce and Bitcoin tumbles. Europe makes some progress and I sell out of impatience. Topping up in US retail and hedging my open trades on technology stocks. And the gold trade will become a hedge when the mine is operating - at the moment it is speculation.

Portfolio News
Market Jitters - Tariff Tantrum
Markets came back from the holiday week in a positive mood though the talking heads keep talking up the fear
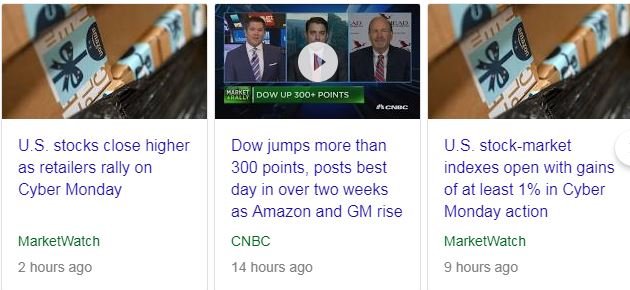
The real drivers were optimism about retail sales through Black Friday and Cyber Monday and a rising oil price. My short term trade on retail sales has some way to go to be profitable but there are still 4 trade days this week to expiry.
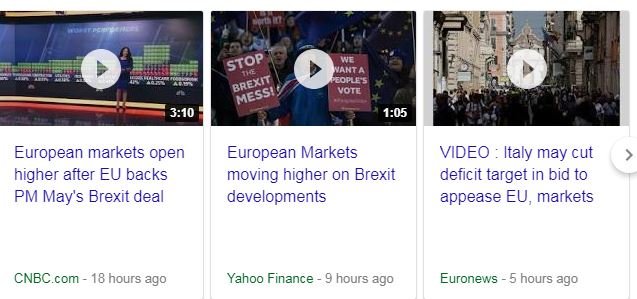
A positive lead coming from Europe with the Brexit deal agreed and some light on Italy certainly helped
Bought
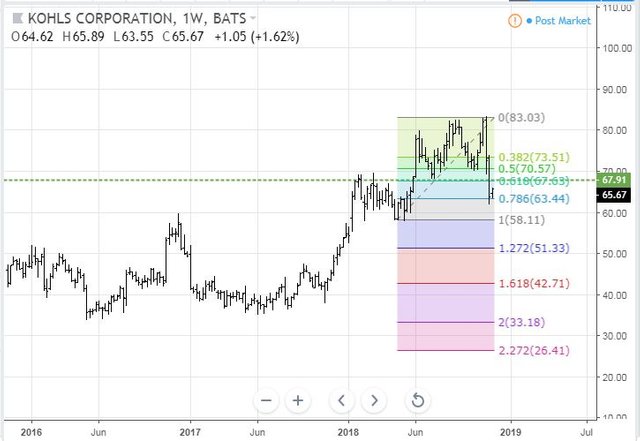
Kohls Corporation (KSS): Us Retail. Topped up a small parcel bought last week in the selloff. A quick update on the chart I in TIB326. Price has tested the 0.786 Fibonacci level and made its first move away from that level in trade today. Note: This is a weekly chart.
De Grey Mining (DEG.AX): Australian Gold Explorer. In one of the fund raising rounds I was allocated unlisted call options on De Grey at $0.10 per share. Those options expire this week and are in-the-money. I exercised those options - as they are unlisted I could not sell them on the market. The chart shows the exercise price (dotted red line) sits below the big price gap that opened in September 2017 when De Grey announced the massive gold discovery on their Pilbara, Western Australia, tenements.
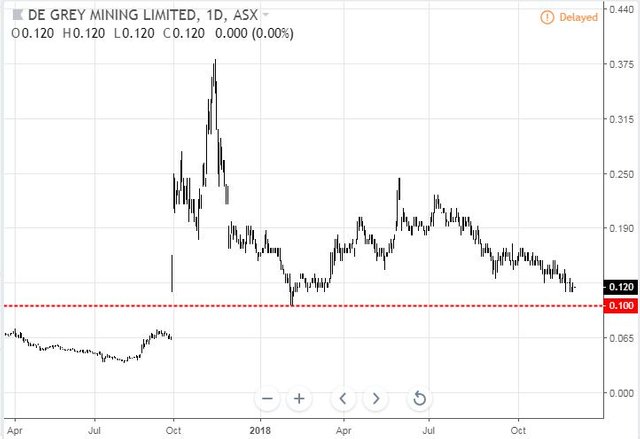
https://stockhead.com.au/resources/pilbara-gold-juniors-strike-iron-hot/
I will be surprised if price drops below this level. The trade does show the challenge of resource investing. Price goes nowhere for ages. The discovery is made and the speculation drives prices up. The reality of the capital requirements and the time it takes to get to production sets in and price dribbles downwards.
Sold
Xtrackers MSCI Europe Hedged Equity ETF (DBEU): Europe Index. Looking to raise some cash in one portfolio. Consistent with my strategy of reducing exposure to Europe at index level I closed a portion of this holding for a 1% profit since January 2015. The investment thesis was that Europe would close some of the gap to S&P500 as its economy grew. A comparative chart of this ETF (DBEU - black bars) and S&P 500 (orange line) shows that the trade idea worked until mid 2015 and then under-performed.
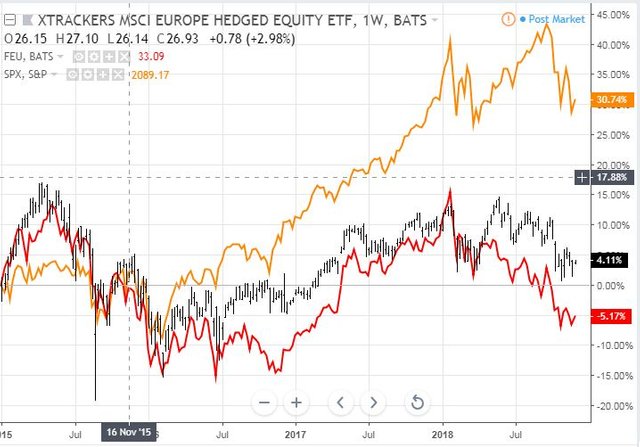
The chart also shows that price is at essentially the same place as it was in January 2015 (+4% less three years worth of inflation). The second part of the trade idea was to use a hedged ETF which protects the trade against drop in the value of the Euro. That part of the trade idea did work. The red line is an unhedged ETF (FEU) which dropped 5% over the time period - that is the 9% drop in the value of the Euro.
Shorts
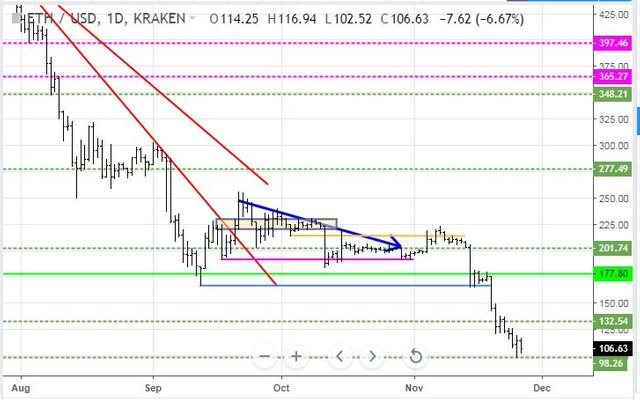
Invesco QQQ Trust (QQQ): Nasdaq Index. The selloff over the last few weeks prompted me to add in another short term hedge trade on the Nasdaq. As last time, I have constructed this as a bear put spread looking to cover a 5% drop in the value of the Nasdaq from current levels. Bought a 162/154 bear put spread with a net premium of $2.55 offering maximum profit potential of 213% if Nasdaq drops 5% in the next two months. Let's look at the chart which shows the bought put (162) as a red ray and the sold put (154) as a blue ray with the expiry date the dotted green line on the right margin
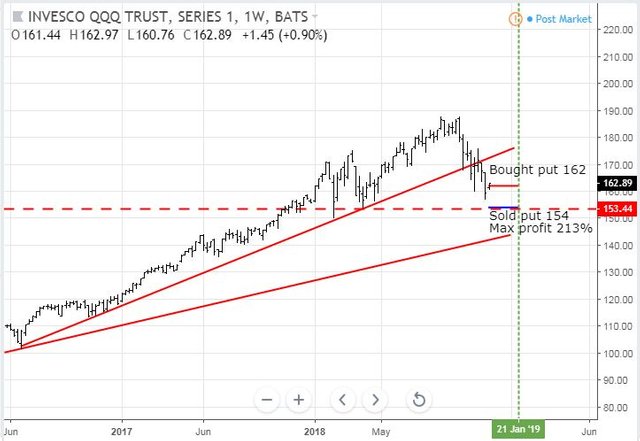
A few things stand out. Price had dropped below the short term uptrend line and tried to break back and failed. That is a bearish sign. Price has also broken past the 0.786 Fibonacci line (not shown) which is also bearish. The maximum profit target (the blue ray) is just above the last cycle low (the dotted red line) which is the next support level if price continues lower. A strong support zone would be where the longer term uptrend line (the lower red line) meets the support line (dotted red line). That happens after expiry date.
Now you may be confused about the FAANG trades I put on last week which seem to contradict this view. This is the nature of hedging. Its job is to protect the rest of the portfolio. Exposure I have put on is 2 contracts which is 2% of the portfolio value. Note I am also short S&P 500 in another trade giving me about 5% hedged (excluding Gold).
Cryptocurency
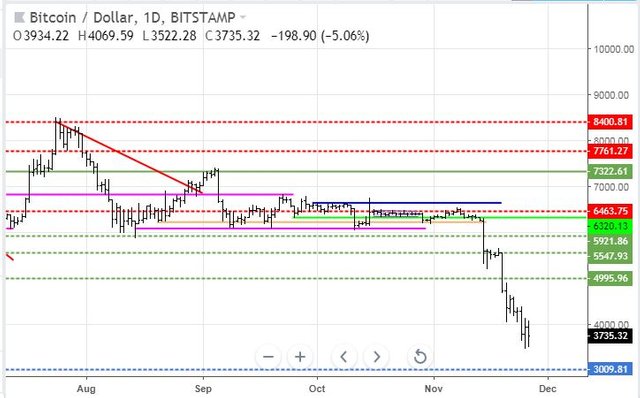
Bitcoin (BTCUSD): Price range for the day was $547 (15.5% of the low). Price made an inside bar on what was a rollercoaster day.
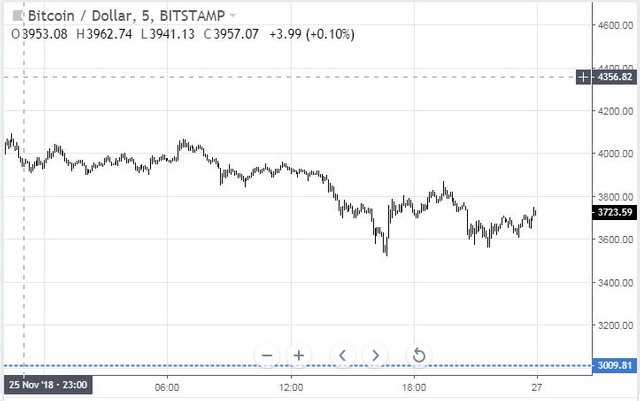
The 5 minute chart shows price having 6 goes at breaking below $3600, which is about the level that my account margin runs out, and a few goes at breaking above $4,000
I presented the mining revenue charts yesterday which showed the challenge that Bitcoin miners are facing. In something of a contrarian mindset, I responded to a Black Friday offer from one of my mining providers to buy Ethereum and Bitcoin mining capacity at a 25% discount. At current prices and electricity costs this is not a profitable investment. My sense is this is a lower cost way to invest in the future price. I bought a 5 year 1 TH/s Bitcoin contract and 2 years 25 Mh/s for Ethereum at Geneis Mining who mine in Iceland.
Ethereum (ETHUSD): Price range for the day was $14 (13.7% of the low). Price also made an inside bar but seems keen to test the $100 level at least one more time.
CryptoBots
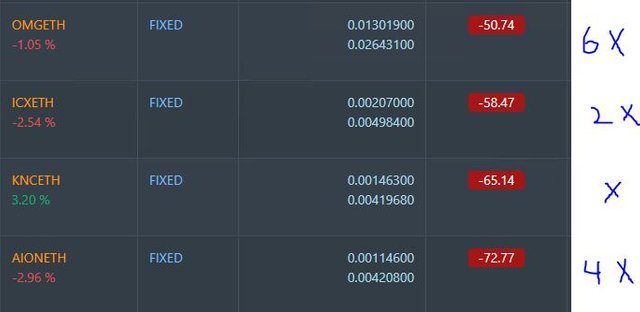
Outsourced Bot No closed trades. (222 closed trades). Problem children now at 19 coins. (>10% down) - ETH (-72%), ZEC (-67%), DASH (-68%), AE (-21%) LTC (-53%), BTS (-62%), ICX (-87%), ADA (-76%), PPT (-85%), DGD (-86%), GAS (-88%), SNT (-66%), STRAT (-80%), NEO (-86%), ETC (-68%), QTUM (-80%), BTG (-72%), XMR (-48%), OMG (-77%).
Coins moved in a tight band of plus or minus 1 point. GAS (-88%) is solo as the worst coin. QTUM (-80%) dropped a level and joined the 80% down club.
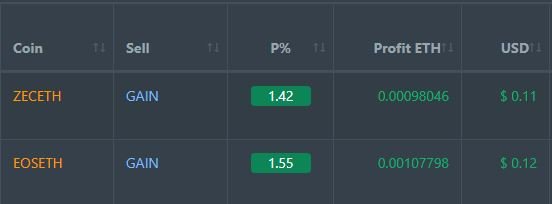
Profit Trailer Bot Two closed trades (1.49% profit) bringing the position on the account to 4.50% profit (was 4.46%) (not accounting for open trades). Of note is neither of these wins were PT Defender trades
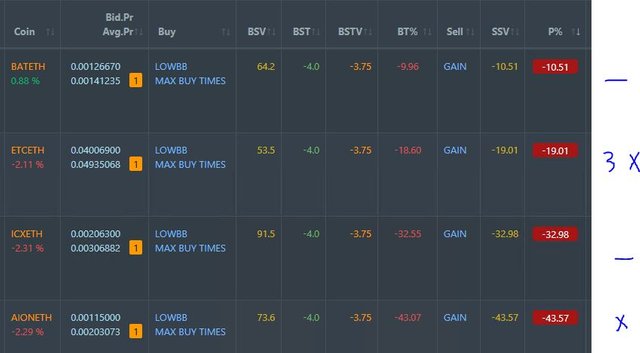
Dollar Cost Average (DCA) list remains at 4 coins with ETC the worst dropping 3 points. BAT has been gyrating for some days now. I am keen to dump it.
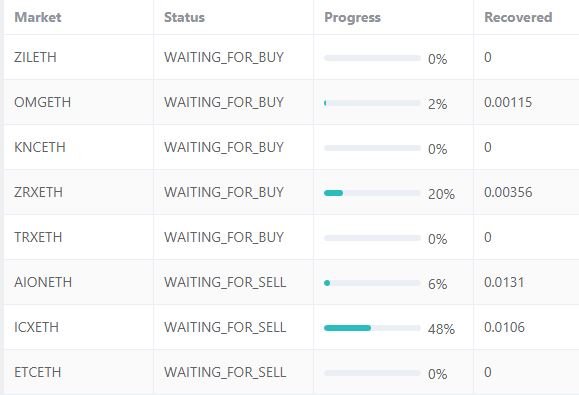
Pending list extended to at 9 coins with ZIL added. Of the rest 1 coin improving, 0 coins trading flat and 7 worse. OMG was the worst.
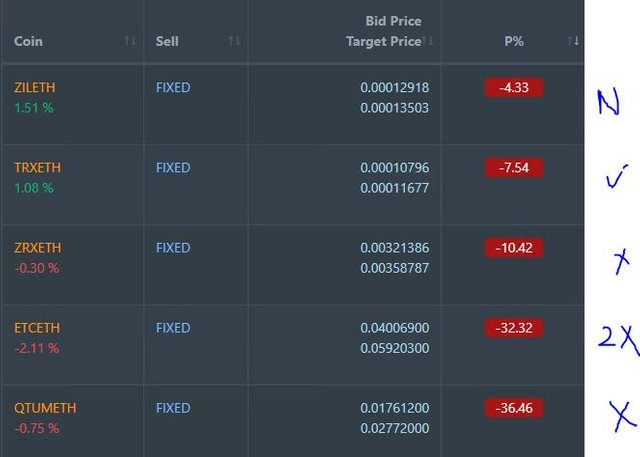
I added ZIL to PT Defender duty as it was down 5%. It is now defending 8 coins. There is still some way to go to clear the troubled trades.
New Trading Bot Trading out using Crypto Prophecy. No trades closed.
Currency Trades
Forex Robot did not close any trades and is trading at a negative equity level of 1.9% (lower than prior day's 2.6%).
Cautions: This is not financial advice. You need to consider your own financial position and take your own advice before you follow any of my ideas
Images: I own the rights to use and edit the Buy Sell image. News headlines come from Google Search. Gold nugget comes from De Grey Mining. All other images are created using my various trading and charting platforms. They are all my own work
Tickers: I monitor my portfolios using Yahoo Finance. The ticker symbols used are Yahoo Finance tickers
Charts: http://mymark.mx/TradingView - this is a free charting package. I have a Pro subscription to get access to real time forex prices
Bitcoin: Get started with mining Bitcoin for as little as $25 http://mymark.mx/Galaxy
November 26, 2018
The mining venture may prove to be interesting in the long run as the mining imbalance stabilizes while you accrue the benefits of longer term price realization. I have not thought about this approach, thanks for sharing!
Posted using Partiko iOS
I figured it was a way to take a long view and to average into a Bitcoin price without having to buy a small amount every now and then. My first mining contracts started in late 2015 when the price was $319. The contracts are still running and I have a repurchase amount set. I do not even look to see how it is doing because it is so far ahead and still works like an annuity.
Love the hedge strategy on the QQQ and FANG.
Thanks. Was thinking on the bicycle today that I have been a bit remiss in reading your posts. Steemit has been a bit like my Bitcoin mining. Apart from my posting it has been set and forget.
I like the puts spread you put on the QQQs, based on the chart it is a money making opp/hedge. I'm actually keeping my eye on opps to get short again on the S&P 500 after catching that last move.