TIB: Today I Bought (and Sold) - An Investors Journal #345 - US Interest Rates, 56 Percent Club Update
US Markets rally for the 3rd day. US interest rates are beginning to stabilise and it is time to bank some profits and consider a rethink on rates strategy. 56 Percent Club update for December shows a massive smack in the selloff.

Portfolio News
Market Rally
Market rally continues into its 3rd day helped along by rising oil prices.
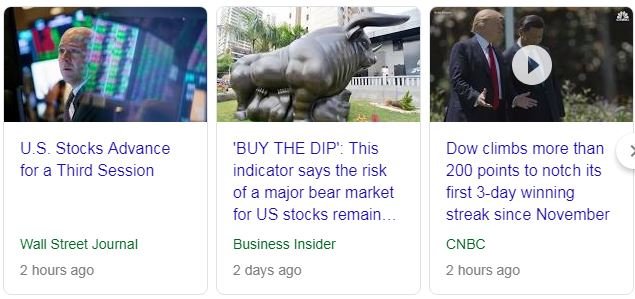
It amazes me how the language of the talking heads swings from selloff to rally. Everyone is upbeat again confident that this rally has legs. Well it may, as the 3 things they were worried about have been calmed down - slowing growth, China and the Fed. Long may it last.
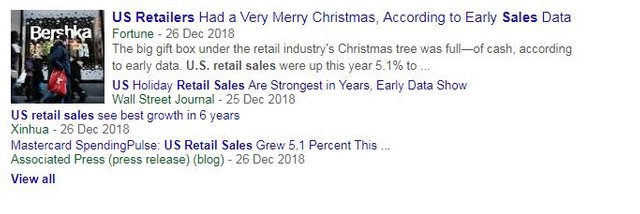
Retail sales look like they were really good for the holidays
There were not good for everyone with JC Penney (JCP) reporting they were not great and laying out plans to close 3 further stores.
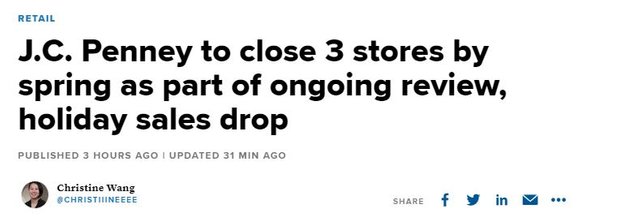
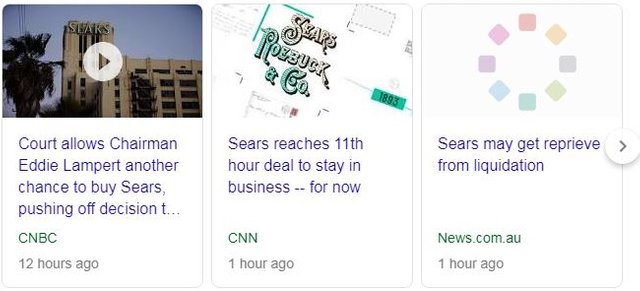
JC Penney shares jumped 18% in trading on Monday but sagged back a bit on Tuesday (I have stock and options in JCP) Meanwhile in the bankruptcy courts, Sears earns some more time to get a deal.
I am not exposed to Sears not even through the SPDR Retail ETF (XRT)
Shorts
Eurodollar Interest Rate Futures (GE M): US Interest Rates. Sold June 2020 strike 98.5 put options for $1.12 premium booking a 104% blended profit since October 2016. Market expectations have shifted to two rate hikes only for 2019 from 3. I decided to close this long held position as there is no asymmetry in the trade and I can only see the profit falling further. The $1.12 implies a 2020 interest rate of around 2.75%.
Let's have a quick look at the chart which shows the purchases and sales of the 98.5 put options (red ray)
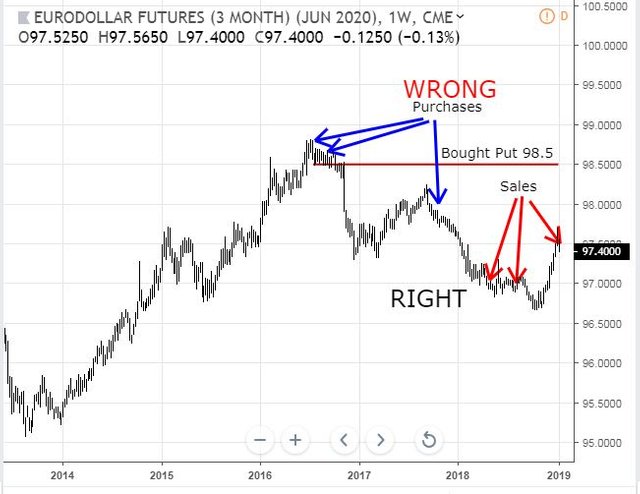
Initial entry is textbook after a lower low is confirmed and a few days later with a lower high. The 2nd entry area is a good example of scaling in. Timing when to exit is always a challenge - get it before the bottom or miss it and get it some time after. In this case there are examples of both
In this portfolio this is the last of these put contracts I am holding. Overall this trade has generated profits of 151% since July 2016 (6 trades ranging from 100% to 187%). I will progressively unwind all US interest rate trades unless I see an uptick in inflation.
56 Percent Club
Each month, I review all my portfolios and tabulate the 56 percent movers from all time and highlighting the ones from the last 12 months. I review stocks and options separately. Why 56%? A friend was spruiking an investment scheme on Facebook and asked if anybody could point to a 56% investment - yup - I have a few.
First is the table of stocks. I have also marked up whether they have gone up or down since last time.
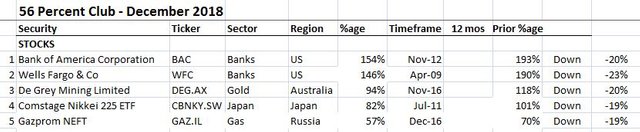
What stands out?
- The list has collapsed in the seloff (5 vs 12). No sales.
- All stocks went down around the 20% level. Wells Fargo (WFC) was biggest faller at -23%
- Bank of America (BAC) retains its top slot
- No new entrants
- Falling off the list is a cross section of stocks in cybersecurity, lithium, financials, technology and Japan.
- None of the stocks were bought in the last 12 months
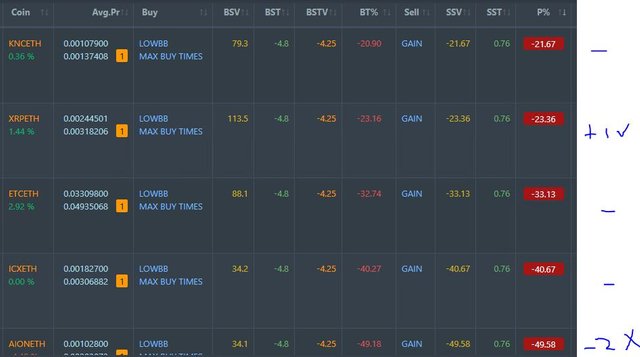
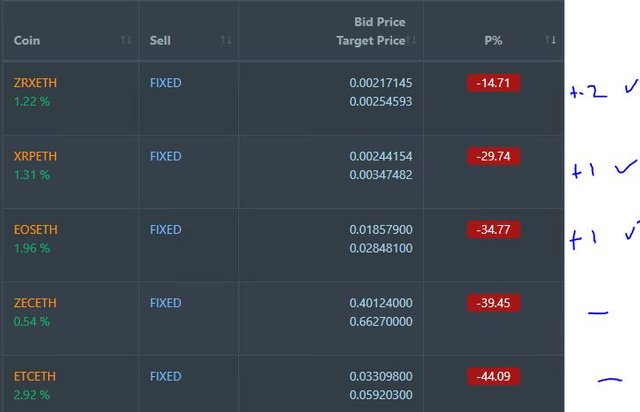
On the options side same deal with Shorts marked in red text - i.e., for trades where I am expecting the market to go down. I have highlighted ones that are new to the club in Yellow.
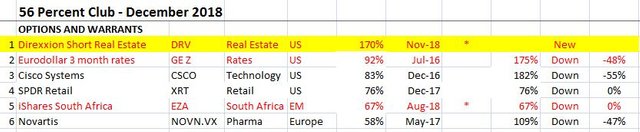
What stands out?
- Selloff continued to hit hard with the list shrunk by another 3 since last time (6 vs 9) with no sales.
- There is a new leader in new entrant Direxxion Short Real Estate ETF (DRV) replacing Consumer Staples Select Sector ETF (XLP) which falls off the list
- Dropped off the list are cybersecurity, oil, consumer staples and insurance
- Biggest casualty still on the list for the month is US network supplier, Cisco Systems (CSCO) dropping 55 points.
- Only riser is Direxxion Short Real Estate ETF (DRV)
- Probably the most surprising move was the SPDR Retail ETF (XRT) holding ground in the face of the selloff. This says a lot about the way retail sales held up over the holidays
- 2 out of 6 positions were bought in the last 12 months.
Cryptocurency
Bitcoin (BTCUSD): Price range for the day was $178 (4.5% of the low). Price did not really know where it wanted to go. So it moved either side of $4000 forming an engulfing bar.
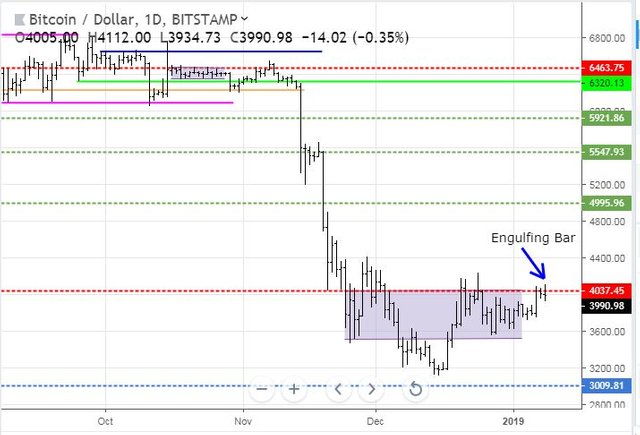
This type of bar often signals a reversal. This is possible as price is at the top of a range and could choose to retrace. To my eye this really looks like an indecision bar - hard to tell which way it could go.
Ethereum (ETHUSD): Price range for the day was $7 (4.6% of the high). This chart looks clearer. Price took out the previous day's low and did not want to push up just yet.
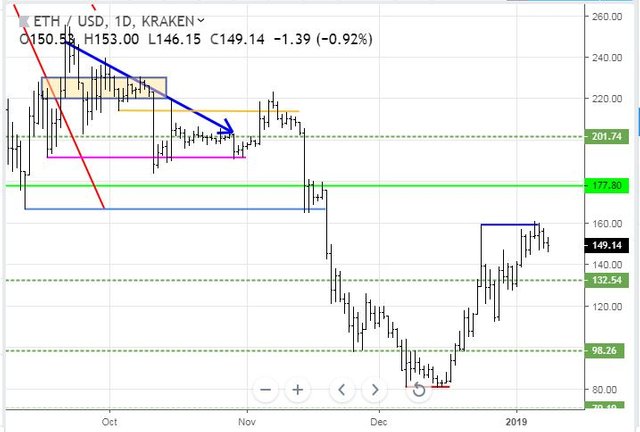
Price needs to hold above the prior day low of $146 to position for a go at passing $160. If not, do not be surprised to see a drift all the way back to support at $132.
CryptoBots
Outsourced Bot No closed trades. (222 closed trades). Problem children remains at 19 coins. (>10% down) - DASH (-73%), ETH (-64%), ZEC (-72%), AE (-45%), LTC (-51%), BTS (-66%), ICX (-85%), ADA (-70%), PPT (-85%), DGD (-84%), GAS (-87%), SNT (-65%), STRAT (-67%), NEO (-83%), ETC (-65%), QTUM (-77%), BTG (-72%), XMR (-51%), OMG (-77%).
Coins moved in a tight band of 1 or 2 points, mostly down. GAS (-87%) remains the worst coin.
Profit Trailer Bot No closed trades.
Dollar Cost Average (DCA) list remains at 5 coins with not much movement.
Pending list remains at 10 coins with 3 coins improving, 6 coins trading flat and 1 worse.
PT Defender continues defending 9 coins. No change.
New Trading Bot Trading out using Crypto Prophecy. No closed trades. Trades open on FUEL, SC, VET, XLM
Currency Trades
Forex Robot Still not working.
Cautions: This is not financial advice. You need to consider your own financial position and take your own advice before you follow any of my ideas
Images: I own the rights to use and edit the Buy Sell image. News headlines come from Google Search and CNBC. All other images are created using my various trading and charting platforms. They are all my own work
Tickers: I monitor my portfolios using Yahoo Finance. The ticker symbols used are Yahoo Finance tickers
Charts: http://mymark.mx/TradingView - this is a free charting package. I have a Pro subscription to get access to real time forex prices
January 8, 2019
Now earnings will soon start to take over the headlines and I think they will start to show more disparity among the different sectors as tax reform will no longer be a low hanging fruit to benefit from this year. Winners and losers will be seen but volatility will remain.
Posted using Partiko iOS
Guidance is going to be what drives sentiment from now - starting with Alcoa