TIB: Today I Bought (and Sold) - An Investors Journal #362 - Corn, Russia, Altcoins
Markets are happy as trade talks progress. Shutdown is averted (for now). Trade action is reversals in Corn and rolling out in Russia.

Portfolio News
Market Rally
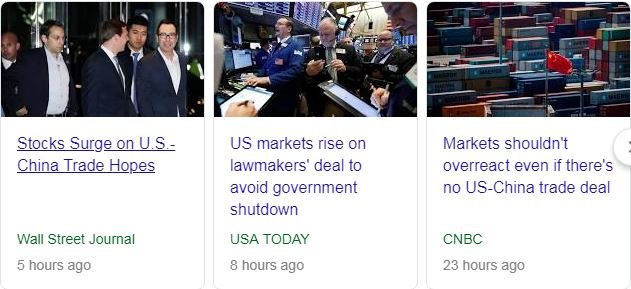
US markets surged on a shutdown deal emerging and positive comments from Donald Trump about a China deal, including the potential to shift the March 1 date.
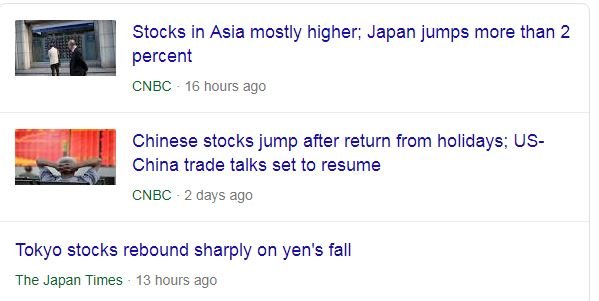
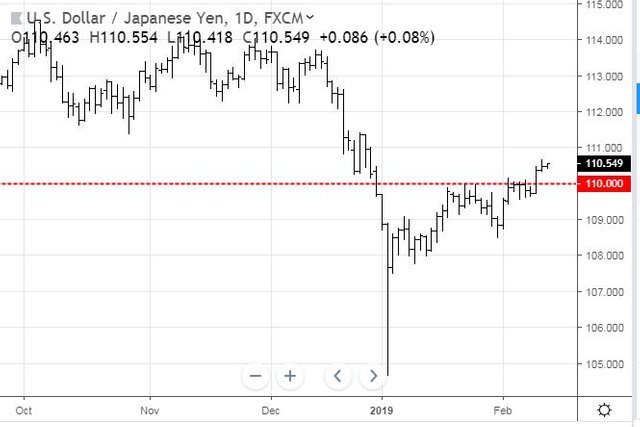
Market sentiment was broad based with Japanese markets jumping 2 percent on the back on a slide in the Japanese Yen back below 110, a level not held since the last day of 2018.
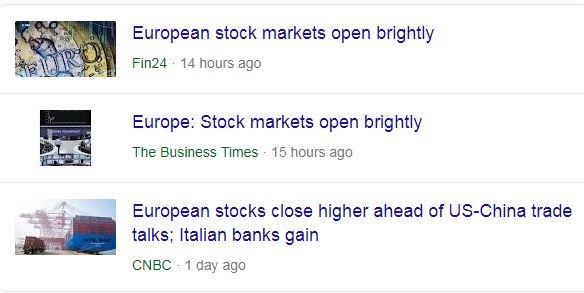
Key move was in Europe with a big improvement in banking stocks, especially Italian Banks.
Bought
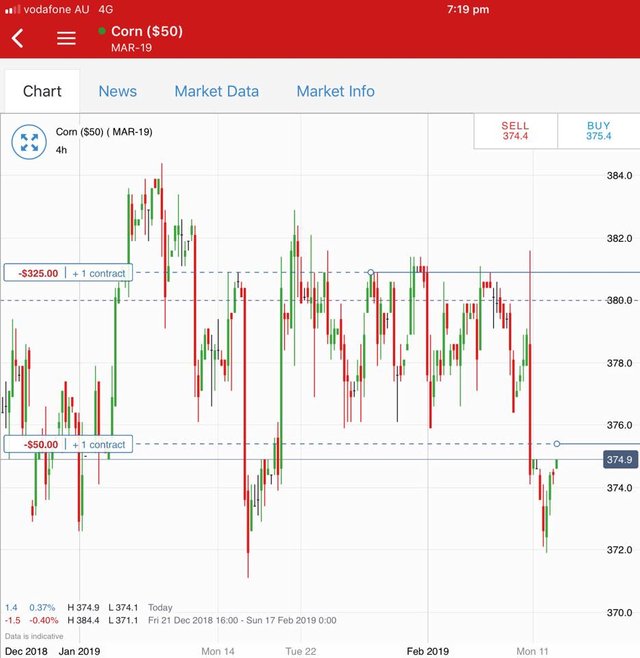
Corn Futures (CORN): Corn. Corn price had been trading in a range between $375 and $380 for close to a month (since Jan 18) and then collapsed through the bottom of the range to test January lows. Hard to say what drove this move but it did coincide with the big polar vortex storm in US and also the weakening US Dollar following Federal Reserve meeting. Neither of these make sense as normally a bad weather event pushes prices up if there is a threat to supply and commodity prices like a weakening US Dollar.
Logic aside, I saw the reversal off those lows on a 4 hour and added a new long contract. I have set the profit target at the top of the range (red dotted line).
The after chart on a daily shows a classic reversal off a low test bar that is testing a level.
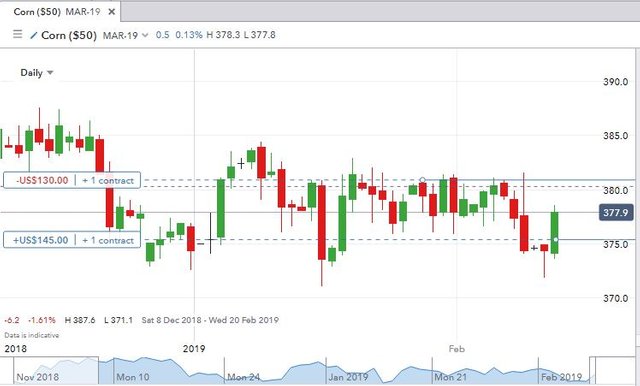
I have written before that my strategy to trade corn is to trade the reversals and to exit at the end of each cycle. I do not always get them right - the left hand trade (left hand blue dot) was a 4 hour reversal which looks less good on the daily chart.
Expiring Options
VanEck Vectors Russia ETF (RSX): Russia Index. Rolled out last February expiry 20 strike call option to March 21 strike call option. 70% profit since the last roll up in Jan 2019 was higher than prior day's 44% and I did not have to give as much away for the March rollup. Quick update on the chart which shows the first trade I am trying to manage out - I recalculated the new breakeven price - it is $21.88 - not $21.75 (green ray) - (error in calcs in TIB361).
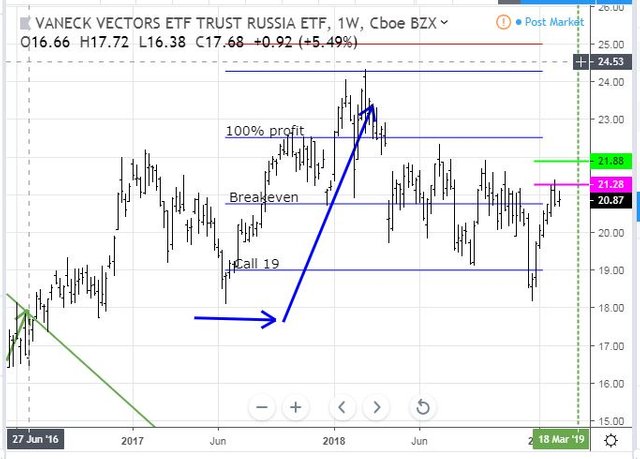
Now this trade will be helped by the commitment from Saudi Arabia to extend its oil production cuts which did push oil prices higher.
Cryptocurency
Bitcoin (BTCUSD): Price range for the day was $71 (2% of the high). Price is drifting towards the bottom of the trading range it traded in for the early part of 2019 (purple parallel channel). It could well find support there
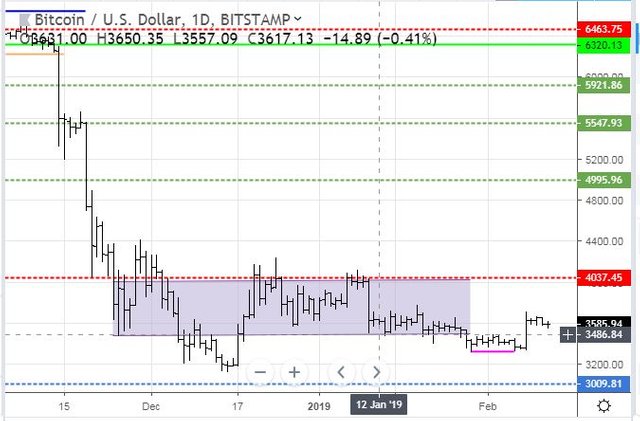
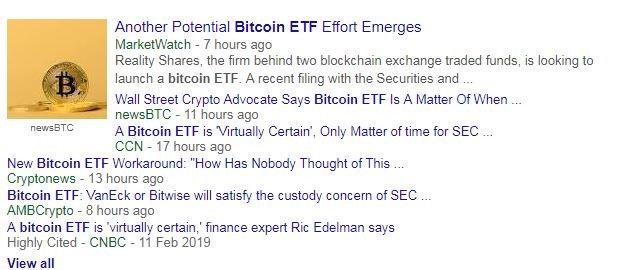
News emerged of a new Bitcoin ETF application being prepared. And there is talk that it is just a matter of time before one gets approved. This has to be good news for price.
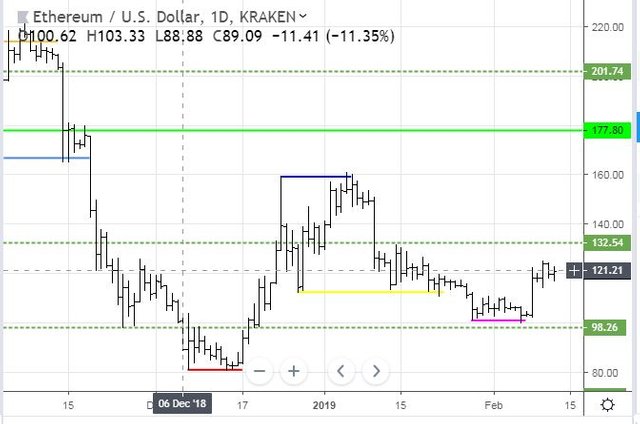
Ethereum (ETHUSD): Price range for the day was $5 (4% of the high). Price drifted lower taking out prior day low but not pushing to make a lower low. At the time of writing this up the new daily bar has not started and price is holding above the midpoint.
CryptoBots
Profit Trailer Bot No closed trades. I did add TRX to PT Defender duties.
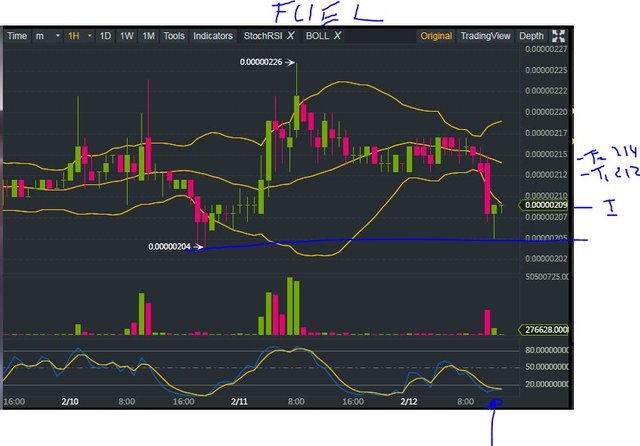
New Trading Bot Trading out using Crypto Prophecy. DCA trade opened on FUEL and half closed out for 1.43% profit - on the T1 line. Trade did not make it to the centre band to reach T2. I have reset T2 to T1 level.
Currency Trades
Outsourced MAM account Actions to Wealth closed out 1 USDJPY trade for 0.18% profits for the day.
Cautions: This is not financial advice. You need to consider your own financial position and take your own advice before you follow any of my ideas
Images: I own the rights to use and edit the Buy Sell image. News headlines come from Google Search. All other images are created using my various trading and charting platforms. They are all my own work
Tickers: I monitor my portfolios using Yahoo Finance. The ticker symbols used are Yahoo Finance tickers
Charts: http://mymark.mx/TradingView - this is a free charting package. I have a Pro subscription to get access to real time forex prices
Crypto Prophecy provides a useful tool to identify oversold and overbought coins - https://mymark.mx/CryptoProphecy
February 12, 2019
I guess the positive sentiment continues to outweigh the negative which makes sense given the indicators are still short term positive.
Posted using Partiko iOS
Perfect time to write some hedging trades.