TIB: Today I Bought (and Sold) - An Investors Journal #374 - Europe, Italy Insurance, Oil Production, 3D Printing, US Healthcare, Japan, China, Europe HR Services
Markets sniff the chances of a trade deal. Surprise profits in Italy get invested in HR. Rise in Europe gives scope to escape from there and deploy more in US healthcare. More contrarian action in 3D Printing.

Portfolio News
Market Rally
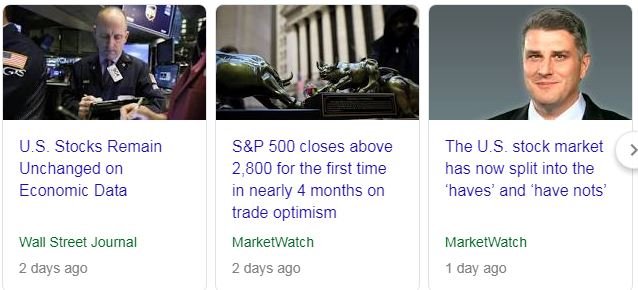
Friday saw US markets in somewhat buoyant mood - not exuberant but the talking heads were buoyant.
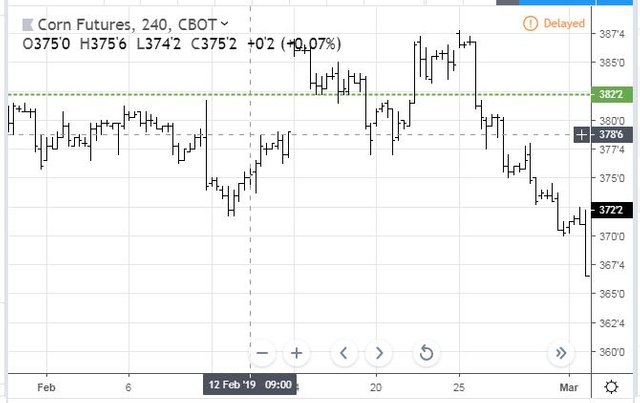
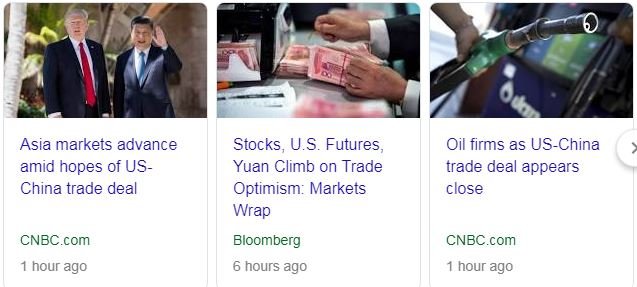
What was driving the mood was information (hard to say how real it was) about the US-China trade deal. The corn price was not happy for a lot of the Friday session - that was telling me to be wary of the trade deal information. [Note: 4 hour chart]
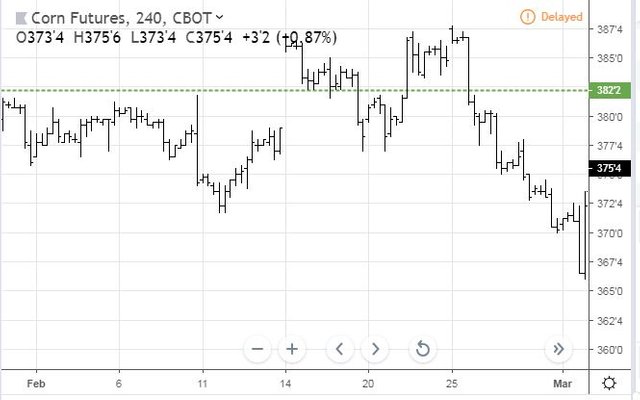
I do not normally trade on Fridays but I was up watching market close (Saturday morning my time) and saw the next bar on the Corn chart - all I have done is move the axis across so you can see the next bar = that jump tells me the trade deal might just happen.
Europe was not left behind - in fact, it was leading the mood.
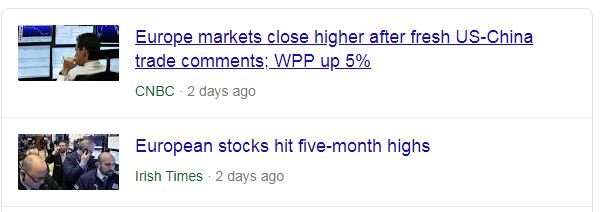
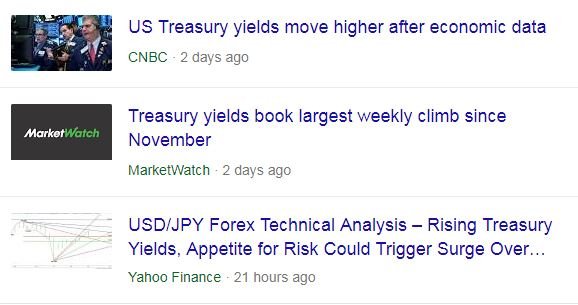
I wrote on Thursday that interest rate markets were more positive than stock markets - that flowed into Friday.
Monday action in Asia is a lot more positive especially adding in the budget news in Japan (more about that tomorrow)
Bought
BP PLC (BP.L): Europe Oil Producer. Deployed spare Pounds to average down my entry price on BP. I was looking at BP as Royal Dutch Shell appeared on a Price to Sales screen - and I had spare Pounds.
Randstad NV (RAND.AS): Europe HR Services. I ran stock screens across all European markets on Friday as prices have bounced and there are stocks showing 20 day highs. I kept coming up with the same names - ING (INGA.AS) and Aegon Insurance (AGN.AS) and motor manufacturers. Randstad was a name that popped up on Price to Sales screens. Now I am heavily invested in Aegon via stock and options and somewhat invested in ING, though only via options. I am reticent to increase my exposure to the European Central Bank and the Europe interest rate madness.
I plotted ING (INGA.AS - black bars) compared with Randstad (orange line) over the last 5 years. While the shapes of the charts are remarkably similar, Randstad has outperformed ING by a few percentage points pretty well all the time. Sometime the gap has been as high as 20 percentage points. I added a small parcel of shares (large enough to write covered calls) to add a European stock that is less directly connected with the Europe interest rates. Dividend yield is 4.83%
CVS Health Corporation (CVS): US Healthcare. Jim Cramer added more CVS to his Action Plus portfolio after the selloff. His view is the "Medicare For All" legislation will not get passed. I added this trade in this portfolio as I could not do the United Health (UNH) trade structure I did the day before in my other portfolios.
I also wrote a covered call against the stock straight away.
Xtrackers Harvest CSI 300 China A ETF (ASHR): China Index. MSCI announced that they would be increasing the weighting for China A-Shares in their market indices from the current 0.70% in phases to over 2%. With the US-China trade talks progressing China A-Shares have been moving ahead. I added a parcel of stock to add to the call options I am holding on the stock. Dividend yield is 1.21%
3D Systems Corporation (DDD): 3D Printing. 3D announced results which disappointed markets with printing equipment sales increasing but margins declining. Share price collapsed as analysts weighed in on margin decline.
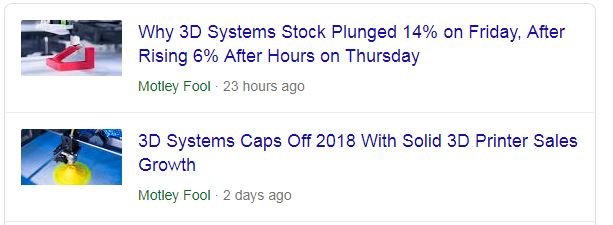
I read a quick Motley Fool review which indicated that margin decline was because of the increasing equipment sales which are at lower margin than consumables. [Note: I am wary of Motley Fool - they like to front run their own stock picks - i.e., they buy the stock and then they write up the story]. My view is a growing footprint of equipment is key to driving a growing consumables annuity stream. I have bought into 3D before with the main premise being the changing nature of their business away from commodity printers into equipment used in industrial scale printing. Analysts are rating the former and not the latter.
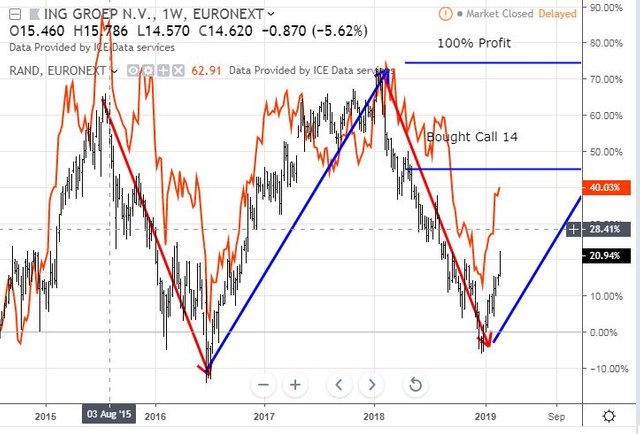
I bought the stock in one portfolio and constructed a call spread risk reversal as follows. Bought January 2021 13/20 bull call spread for $1.85 net premium (14% of bought strike) and sold a January 2021 strike 8 put for $1.35. This brings the net premium down to $0.50 (3.8% of strike) offering a maximum profit potential of 1,300% if price passes $20 before January 2021.
[Note: You might think that I have fallen in love with Call Spread Risk Reversals and every nail looks like it needs one. They carry substantial downside risk if price collapses well below the sold put levels and one does not have enough capital to carry the margin. This is highly possible if the whole market collapses. I have a tally of what my risk is and I will hold the line at the 3 or 4 that I am currently running only 2 of which are long term].
The chart looks a little complicated as it has my last options trade on it as well. The new trade is shown on the right hand side with bought call (13), the purple ray, the sold call (20) the dotted red ray and the sold put (8) the purple ray.
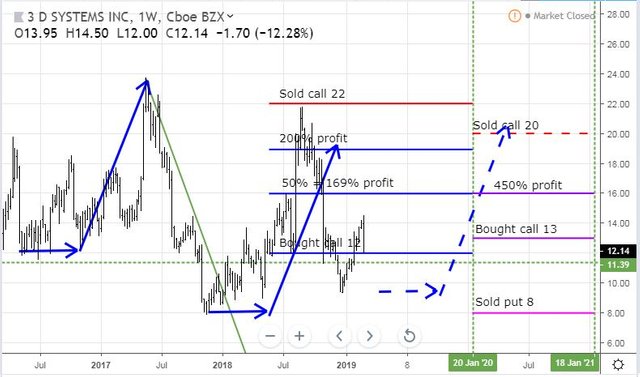
The sold put is about the level of the 2017 lows ($7.92). I would be happy to buy in there. Price had run to the blue arrow price scenario and beyond (steeper and higher) and then fallen back in the selloff. The market reaction to the results announcement is very much against the pattern. I have modelled a new price scenario (dotted blue arrows) and assumed that price could drop more in the next few days maybe even all the way back to 2018 lows. If price follows a scenario like this the new trade will make maximum profit. The 2020 expiry trade has a chance of making it to the 50% line (169% profit) but really needs a short period of consolidation.
My instinct is that China trade deal will change the dynamics for this entirely and we could see price pass the 2018 highs in 2019.
Sold
Unipol Gruppo Finanziaria (UNI.MI): Italy Insurance. Price hit take profit set at 52 week high for 21% profit since December 2016. Who would believe that one could make 21% profit in Italy in just over 2 years? Europe Insurance has been a quiet performer while Europe has drifted.
Wisdom Tree Japan Small Caps ETF (DFJ): Japan Small Caps Index. Profit taking sale to release funds for CVS purchase. In this portfolio, I remain invested in Japan directly through Japanese stocks and some sector ETF's including a small remaining holding of this ETF. 34% profit since February 2016. Nobody was investing in Japan then either.
SPDR STOXX Europe 50 ETF (FEU): Europe Index. Been waiting for European stock prices to break off the lows since the selloff so that I can reduce holdings in Europe at a profit. There are better opportunities outside Europe. Closed partial position in one portfolio for 0.9% profit since November 2012. This might look like an impatient exit but it sure shows how hard it has been to stay invested in Europe.
Income Trades
CVS Health Corporation (CVS): US Healthcare. Sold March 2019 strike 61 calls for 0.40% premium (0.39% to purchase price). Closing price $57.83 (lower than last trade). Price needs to move another 5.5% to reach the sold strike (new trade). Should price pass the sold strike I book a 4.7% capital gain. Premium is for only two weeks exposure.
Cryptocurency
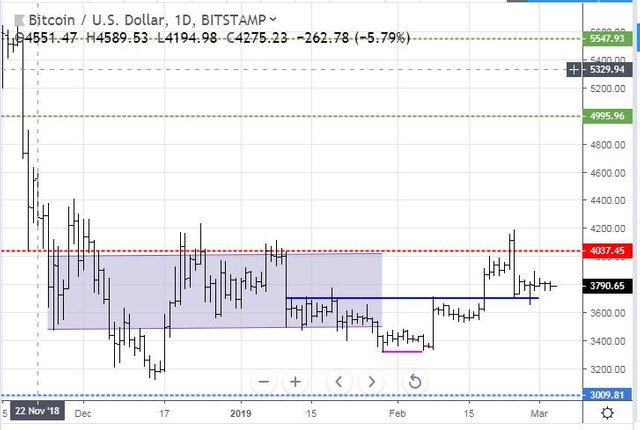
Bitcoin (BTCUSD): Price range for the weekend was $89 (2.3% of the open). Trading bands were tight over the weekend with price hardly moving more than 1% either side of the Friday open.
Ethereum (ETHUSD): Price range for the weekend was $10 (7.2% of the high). Price behaviour was quite different to Bitcoin with price moving steadily lower and closing below the long time support level of $132. I have drawn in a short term support line (purple ray).
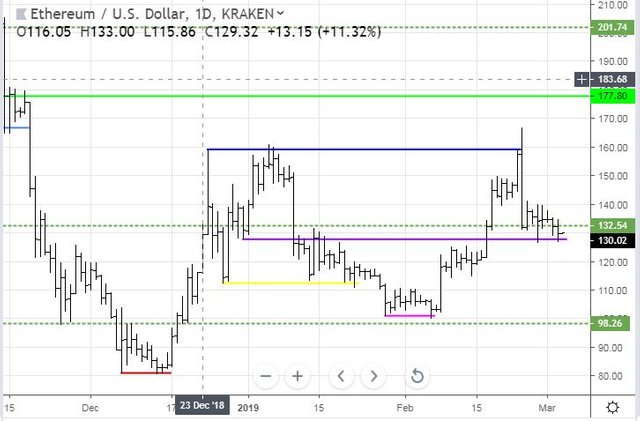
This respect for short term levels tells me that the majority of traders are using lower time frame charts to base their trading decisions (I use dailies). These levels are seemingly more important than long held support levels (that $132 level goes back to July 2017)
CryptoBots
Profit Trailer Bot Five closed trades (1.78% profit) bringing the position on the account to 6.20% profit (was 6.05%) (not accounting for open trades). Most notable win was KNC coming off a very long spell on DCA.
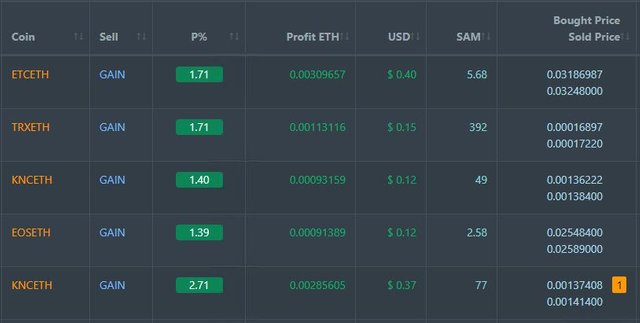
Dollar Cost Average (DCA) list drops to 3 coins with KNC moving off and onto profit after one level of DCA. ICX gave back most of gains from last week.
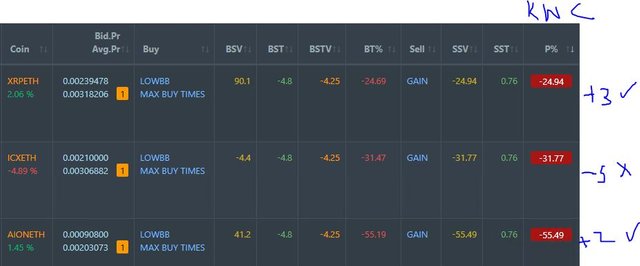
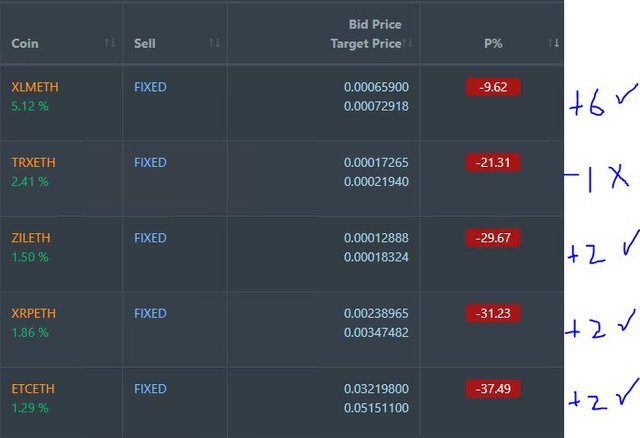
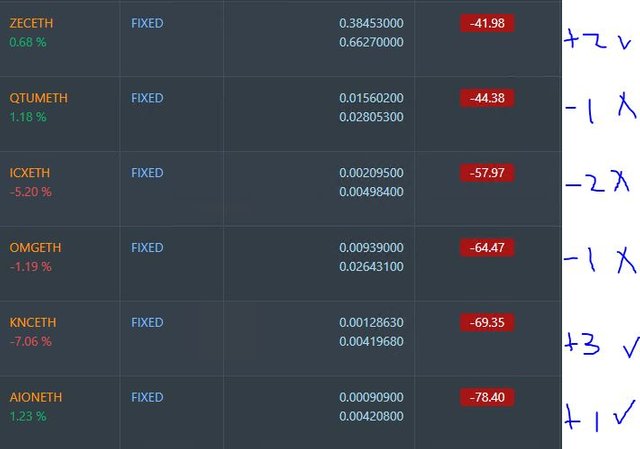
Pending list remains at 11 coins with 7 coins improving, 0 coins trading flat and 4 worse.
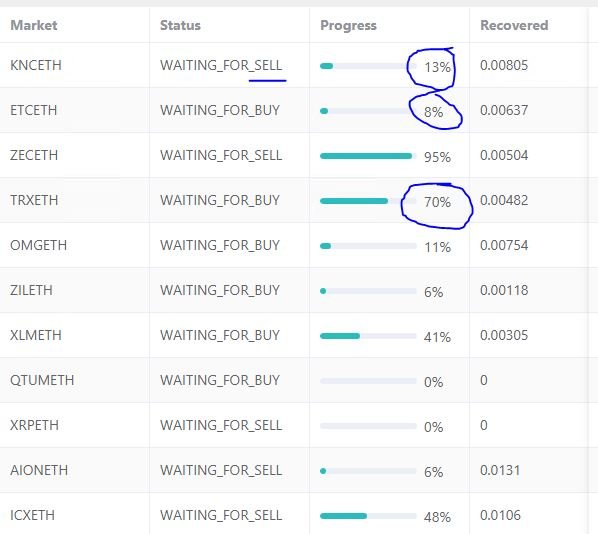
PT Defender continues defending 11 coins with 3 successful defence trades on KNC, ETC and TRX.
This higher level of activity in the bot follows the slide in the ETH price relative to BTC - traders start to switch out of ETH but not out of altcoins. When both BTC and ETH slide, all coins get hit.
New Trading Bot Trading out using Crypto Prophecy. One DC A trade closed on FUEL (1.90% profits). Trades remain open on FUEL, SC, VET and XLM
Currency Trades
Outsourced MAM account Actions to Wealth closed out 1 trade on EURUSD for 0.11% loss for the day.
Cautions: This is not financial advice. You need to consider your own financial position and take your own advice before you follow any of my ideas
Images: I own the rights to use and edit the Buy Sell image. News headlines come from Google Search. All other images are created using my various trading and charting platforms. They are all my own work
Tickers: I monitor my portfolios using Yahoo Finance. The ticker symbols used are Yahoo Finance tickers
Charts: http://mymark.mx/TradingView - this is a free charting package. I have a Pro subscription to get access to real time forex prices
Crypto Prophecy provides a useful tool to identify oversold and overbought coins -
https://mymark.mx/CryptoProphecy
February 28, 2019
Unless the agreement is extraordinary, I don’t think any announcement will add to the bounce we have seen until the details and execution gets into corporate expectations. Risk could be to the downside.
Posted using Partiko iOS
I don't follow the ag products, but actually just put the charts on my platform to look at them from a macro viewpoint. In general, 3D printing's hype has died down, but I think it has a bright future.
Agriculture is a conundrum. Population is growing. Food demand is growing. Agricultural productivity is improving. Yet prices go down. Just look at a long run chart of Corn or Wheat prices.
Who would want to be a farmer? I am persisting as I think we will ultimately see the price curves change as demand grows (and subsidies are kicked out). Too bad there are not any large scale farming businesses listed. The other proxies are fertilizer and John Deere (DE). I am doing fertilizer too but not DE. .
Seems like a lot of good action. Where and how do you use these crypto bots? Would you recommend them?
Posted using Partiko iOS
Interested about the trading bot as well. I've done a little research on them, but not sure about using them. I've tried setting up some to use, but it just all seemed too complicated.
Same here I’m looking for something fairly waist to setup and operate.
Posted using Partiko iOS
Any trading bot is only as good as the trader who sets them up and only as good as that trader understands the markets they want to trade in. I have made a few key mistakes along the way and am still digging myself out. That is what the big Pending List is.
There are a few bots. I use Profit Trailer as I could buy access for a fixed amount - no monthly subscription. It provides the basic tools I need - buy triggers based on EMA changes and/or Bollinger Bands; trailing buy (so you can track an entry price as it slides down and buy when it reverses); DCA (I use only one level) and Sell Only mode triggers. I run it on a VPS so I can guarantee uptime - this does carry a monthly charge. I also use PT Defender to manage trades that go bad (working that Pending List). I trade on Binance with the bot.
My strategy is simple. A whitelist of coins not likely to by pumped and dumped (pick the top 10 by market cap - I currently have 11). Two buy strategies (EMA GAIN which measures the gap between two EMA curves and buys when the gap opens up and then trails as it begins to close. LOW BB - when price goes below the lower Bollinger Band). Profit taking is reverse of GAIN at 1.35% profit target. DCA cuts in at 4.5%. When I fix the Pending List I will run a 7.5% stop loss. This means one can lose 1 trade out of every 6 trades (better 7). I run between 4 and 6 trades at a time with trade size 1.75% (4 is better)
This guy is a good source for training and for staying sane.
Congratulations @carrinm! You have completed the following achievement on the Steem blockchain and have been rewarded with new badge(s) :
Click here to view your Board
If you no longer want to receive notifications, reply to this comment with the word
STOPTo support your work, I also upvoted your post!
Do not miss the last post from @steemitboard:
Vote for @Steemitboard as a witness and get one more award and increased upvotes!