TIB: Today I Bought (and Sold) - An Investors Journal #376 - Health Products, US Healthcare, Europe, 3D Printing, 56 Percent Club
Where is the trade deal? Applied the 3 day rule in 3D printing and taking action to protect from more of a Europe fall - take profits and use the cash to hedge Europe. And an update for 56 Percent Club for February - cannabis makes the list.

Portfolio News
Market Slide Continues
Markets continued to slide in the absence of trade news
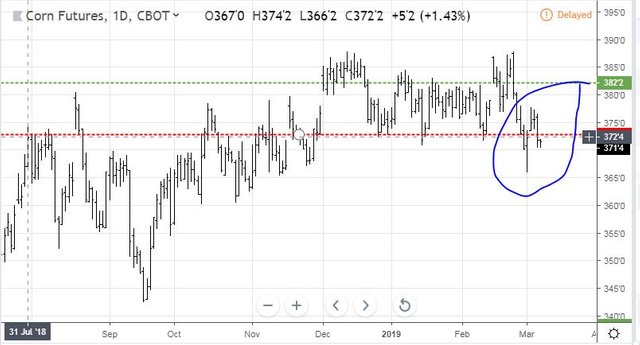
US markets did bounce off the days lows during the afternoon session. My bellwether charts tells me that there is some way to go to get a trade deal - corn breaks below the range again.
More worrying was the European Central Bank cutting its growth forecast.
Yes it is only a forecast and not real data and that is what the market seemed to think. It did prompt me to think about hedging Europe.
Bought
Bod Australia Limited (BDA.AX): Australian Health Products. This company supplies a range of natural health products and have added a cannabis oil product to the range. I wrote in January that I would average down if price drops another 5%. Pending orders were hit in two partial fills (See TIB350 for the rationale)
3D Systems Corporation (DDD): 3D Printing. Experienced traders apply a 3 day rule for earnings disappointments. I skipped that rule after 3D disappointed in its earnings the other day. I then waited 3 days and added another small parcel of stock to average down. 3 day was the right thing to do - programming that into my head by writing this down.
Sold
WisdomTree Europe Equity ETF GBP Hedged (HEDP.L): Europe Index. Looking to raise some cash to fund pensions in my pension portfolio and take some profits. 11.6% profit since July 2016. A quick chart to check if the hedging worked given how badly the British Pound, in which this stock is listed, did. The chart shows HEDP.L (black bars) compared to Europe listing for iShares Europe ETF (IMEU.DE - orange line).
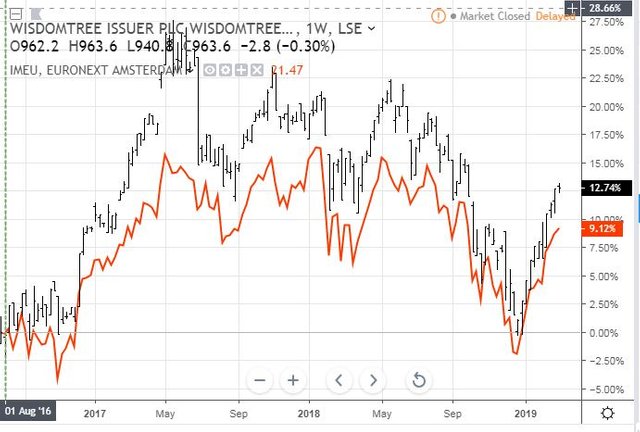
The hedged stock was 3 percentage points better on an absolute comparison. In that same timeframe, the Pound weakened by 2.9% against the Euro - so 3% of the performance came from the Euro. Now for me the important currency comparison is GBPAUD. GBP was 6.9% stronger than Australian Dollar - turning this into a 18.5% return - a little below long run average equity growth rates.
Shorts
Vanguard FTSE Europe ETF (VGK): Europe Index. Hedge trades on Europe expire next week. Talking heads were talking about this low volatility period being the perfect time to buy protection. That reminded me what Hari Krishnan writes in The Second Leg Down - exactly that. So I added hedging trades for June expiry buying a June 2019 51/48 put ratio spread.
Details of the trade are to buy one 51 strike put options and sell two 48 strike put options. Net premium was $0.12 which is 0.23% of strike = cheap insurance. With closing price of $53.63, the protection kicks in for 5.15% drop in market and extends to 11.7% drop in market for next 3 months.
Let's look at the chart which shows the bought put (51) as a pink ray and the sold put (48) as a dotted pink ray with the expiry date the dotted green line on the right margin. I have left in the expiring trades on the left.
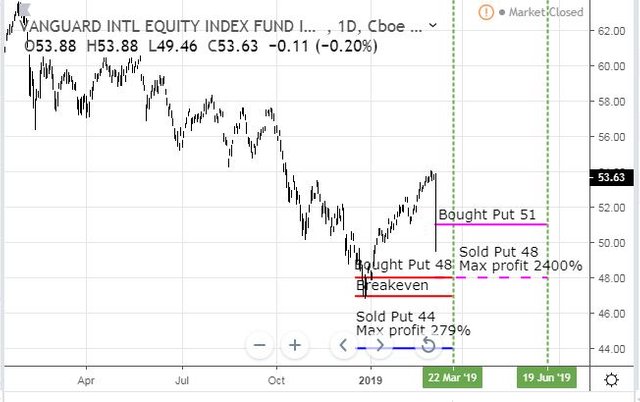
There is a price anomaly on the chart - that spike down is a rogue trade. The last hedging trade I did was bought while market was heading down - looked good for a while and then reversed. Welcome to hedging land. The new trade has the bottom of the protection zone above the December 2018 lows. I picked the $48 level as it gave me the better premium and it is over 10% below current market levels.
There is risk in the trade if price falls dramatically below the sold put level (48) as I have twice as many puts sold as bought = uncovered on 4 contracts. There is a trade management task if price does fall particularly hard.
Get the Second Leg Down book here from Amazon - well researched but hard work reading.

56 Percent Club
Each month, I review all my portfolios and tabulate the 56 percent movers from all time and highlighting the ones from the last 12 months. I review stocks and options separately. Why 56%? A friend was spruiking an investment scheme on Facebook and asked if anybody could point to a 56% investment - yup - I have a few.
First is the table of stocks. I have also marked up whether they have gone up or down since last time. New entrants are in yellow.
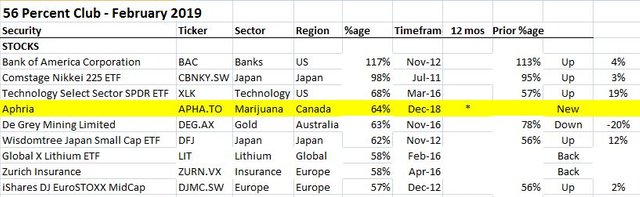
What stands out?
- A longer list by 1 with one new stock and two coming back and two falling off (9 vs 8)
- Bank of America (BAC) retains its top slot with a small improvement in performance
- One new entrant in Canadian marijuana stock, Aphria (APHA.TO). It was an honourable mention last month
- Return to the list for 2 stocks in Lithium (LIT) and European Insurance (ZURN.VX).
- Biggest riser was Technology Sector ETF (XLK) leading the bounce from the selloff lows
- Japan still features
- One of the stocks was bought in the last 12 months (APHA.TO)
- Two fallers off the list in cybersecurity, FireEye (FEYE) and Russian gas producer, Gazprom NEFT (GAZ.IL)
- Of the remainers on the list only one went down (De Grey Mining (DEG.AX))
On the options side same deal. I have highlighted ones that are new to the club in Yellow.
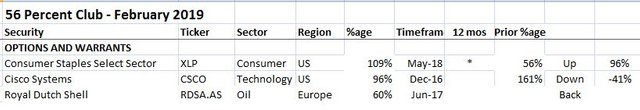
What stands out?
- There is a new leader in Consumer Staples ETF (XLP) displacing Cisco Systems (CSCO)
- Cisco Systems move down comes as the leading contract last month was sold - so this is a different contract.
- New to the list is a return for oil giant, Royal Dutch Shell (RDSA.AS)
- Gone from the list are last month's surprise entrant, Air France KLM (AF.PA), the French/Dutch airline, puts on South Africa ETF (EZA) and cybersecurity supplier, FireEye
- List reduces to 3 from 5 - this surprised me in an up month for stocks.
- Only 1 position was bought in the last 12 months.
Income Trades
One more covered call written with a week to go to expiry.
CVS Health Corporation (CVS): US Healthcare. Sold March 2019 strike 57 calls for 0.33% premium (0.28% to purchase price). Closing price $54.00 (lower than last trade). Price needs to move another 5.6% to reach the sold strike (easier than last trade). Should price pass the sold strike I book a 11% capital loss. Income to date amounts to 1.01% of purchase cost.
This looks like a crazy trade. I was looking at the wrong purchase cost in this portfolio when I made the trade = trading mistake. BUT my sense is that healthcare stocks have become so much out of favour that a move more than 5% up in a week is just not going to happen. Add in the resignation of Scott Gottliebsen from the Federal Drug Administration - this is a backwards move for US healthcare.
Cryptocurency
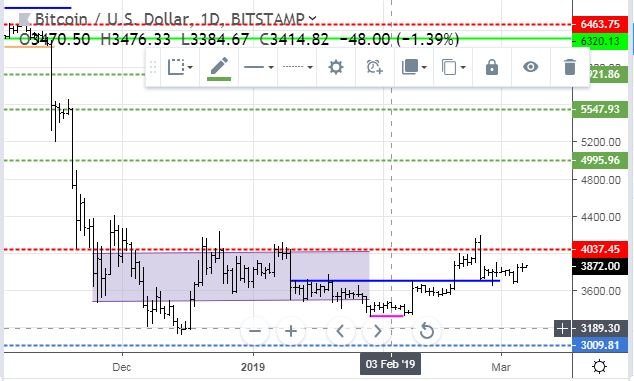
Bitcoin (BTCUSD): Price range for the day was $87 (2.3% of the low). A quiet day but did push higher than prior day to just top $3895, which is where I moved my take profit target from the day before
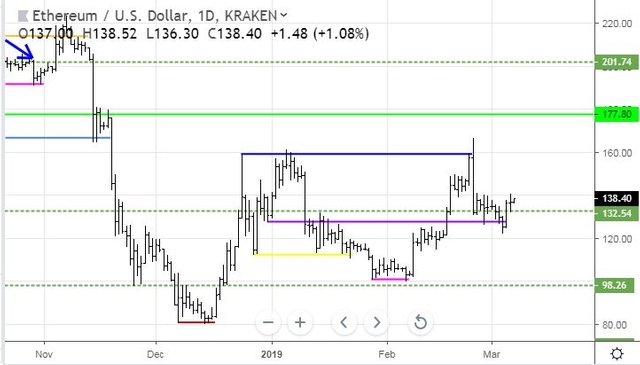
Ethereum (ETHUSD): Price range for the day was $8 (6% of the low). Price pushed a bit more firmly than Bitcoin and importantly held the day's low exactly on the $132 support level. This wants to go higher.
CryptoBots
Profit Trailer Bot No closed trades
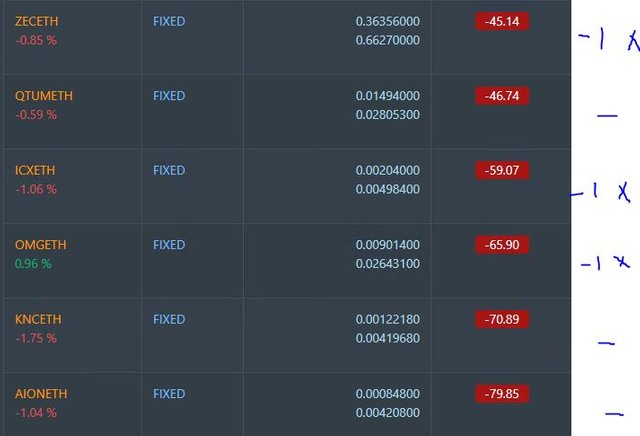
Dollar Cost Average (DCA) list grows to 5 coins with KNC and ZEC joining. KNC adds one level of DCA
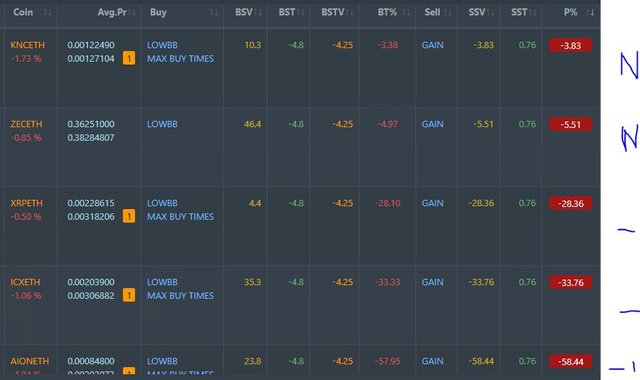
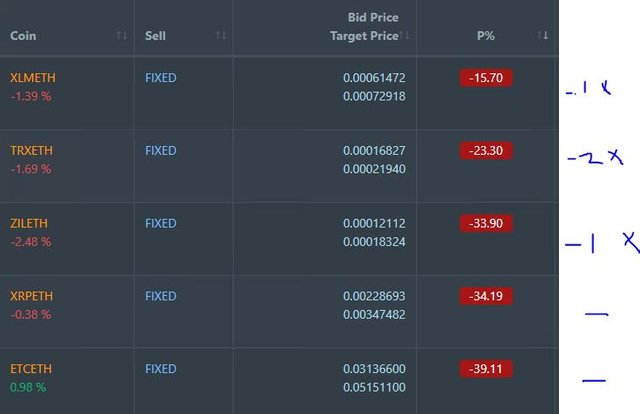
Pending list remains at 11 coins with 0 coins improving, 5 coins trading flat and 6 worse.
PT Defender continues defending 11 coins. No change
New Trading Bot Trading out using Crypto Prophecy. No closed trades.
Currency Trades
Outsourced MAM account Actions to Wealth closed out 1 trade for 0.16% profits for the day. Trades open on CHFJPY and AUDNZD.
Cautions: This is not financial advice. You need to consider your own financial position and take your own advice before you follow any of my ideas
Images: I own the rights to use and edit the Buy Sell image. News headlines come from Google Search. All other images are created using my various trading and charting platforms. They are all my own work
Tickers: I monitor my portfolios using Yahoo Finance. The ticker symbols used are Yahoo Finance tickers
Charts: http://mymark.mx/TradingView - this is a free charting package. I have a Pro subscription to get access to real time forex prices
Bitcoin: Get started with mining Bitcoin for as little as $25 http://mymark.mx/Galaxy
March 6, 2019
Europe is concerning as their tools to combat a decline in economic activity is limited at this point and the variance among the countries will make the EU look unbalanced among themselves.
Posted using Partiko iOS
Big rant coming about Europe in today's post. They are the masters of muddling through and they are in the grip of a Franco-German fiscal game that looks after their interests only.
This post has received a 28.68 % upvote from @boomerang.