TIB: Today I Bought (and Sold) - An Investors Journal #377 - Semiconductors, Marijuana, Australian Banks, Rare Earths, US Technology
Nerves lead to stumbles. Bottom fishing in technology, riding the bounce in rare earths/strategic metals and going short Aussie banks

Portfolio News
Market Slide Continues
The slide turns to a stumble with concerns about global growth reinforced by European Central Bank (ECB) dropping growth forecasts.
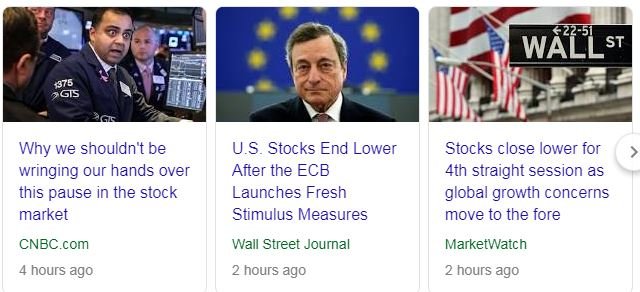
Markets sometimes seem inconsistent. When the Federal Reserve softened its tone in January, the markets voted the move with an up move. When the ECB does the same in March, the markets vote for down. It is all a matter of timing. The Federal Reserve read the conditions right and responded = happy market. The best comment from the talking heads about the ECB was:
the opporutnity to turn dovish is in the rear view mirror
Europe Muddles
I have long written about Europe muddles.
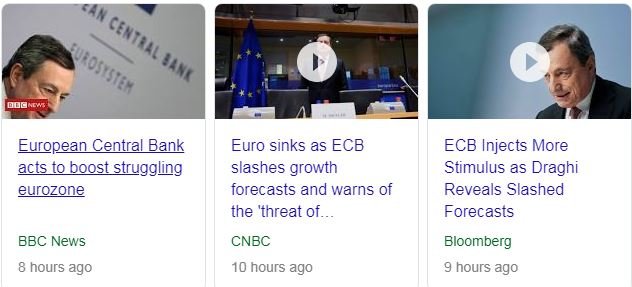
Mario Draghi was petrified to make a move in the autumn and did nothing and just waffles around the point. A chart I posted on European rates before I went to bed last night
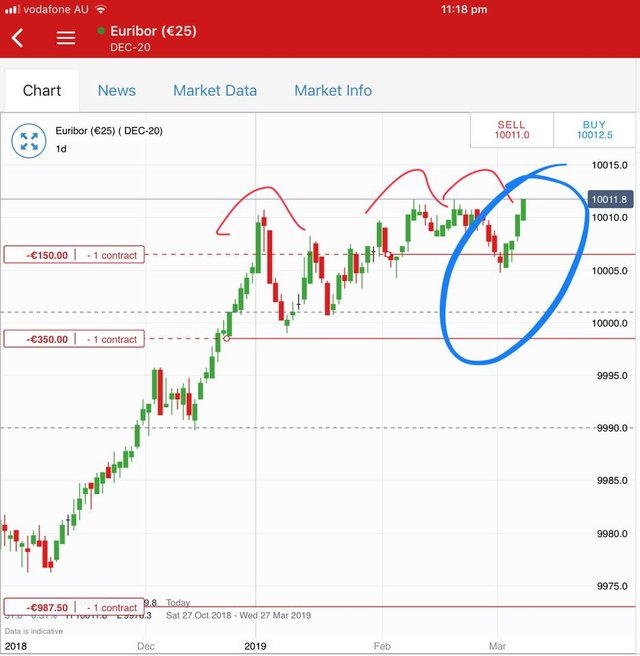
Now he discovers there is no rabbit in the hat - it made a run for it. Next chart from this morning. Can you imagine that interest rates in December 2020 will be one rate hike (25 basis points) negative?
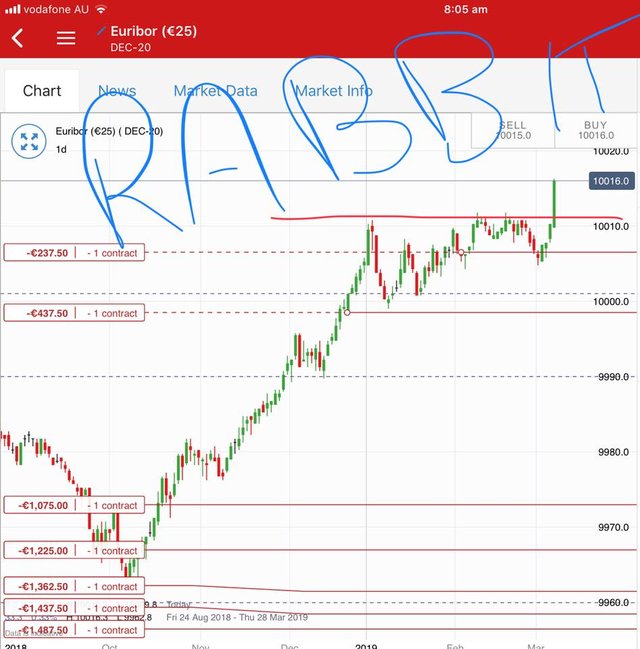
Imagine how bad this is going to get when Donald Trump aims the trade bazooka at Europe, 5 minutes after he concludes a China deal. The real core of the problem is the European Union has hamstrung its member governments with their inflexible deficit caps. Governments cannot help by raising spending or cutting taxes. The magician has no rabbit and he only has one leg to stand on - a monetary leg.
Cannabis Carnival
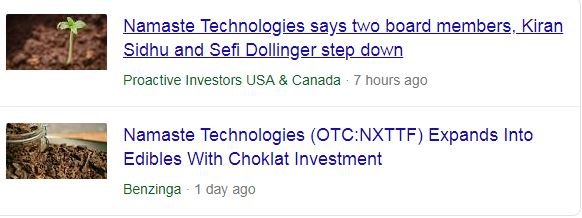
The carnival continues with two announcements from Namaste Technologies (N.V) buying into edible marijuana distribution and two board members resigning
Bought
Namaste Technologies Inc (N.V): Canadian Marijuana. Share price has been under the whip since the scandal broke about related entities and board directors on acquisitions made by the company. This resulted in a strategic review being started - no news on what has come out of that. The two news items today show me that the business is still moving ahead - remove the problem directors (one was the CEO until the scandal broke) and still building out the vision. I doubled my holding in both portfolios - thinking this is probably the bottom.
Lam Research Corporation (LRCX): US Semiconductors. Jim Cramer keeps adding to his Action Plus portfolio on the way down - I followed him.
VanEck Vectors Rare Earth/Strat Mtls ETF (REMX): Rare Earths/Strategic Metals. As the US-China trade talks have been progressing, I have been watching the price of this ETF come off the lows. I have had bids on a Call Spread Risk Reversal Trade for some time but was not getting any response. Liquidity in the options is quite low. With a bit of a sell off in markets today, I could see some light mostly by looking to sell a put at a higher strike than I last tried. I bought August 2019 16/18 Bull call spread for net premium of $0.77 and sold 13 strike put option for $0.22 bringing the net premium to $0.55 offering 263% profit potential for a 12% move in price.
The chart shows shows the bought call (16) as a blue ray and the sold call (18) as a red ray and the sold put (13) as a dotted red ray with the expiry date the dotted green line on the right margin.
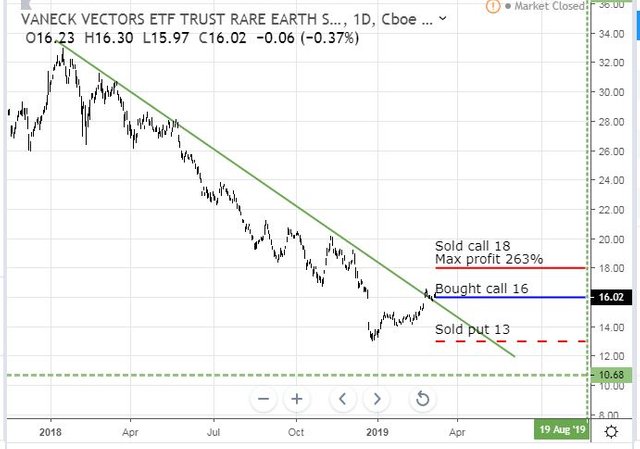
Notice how price is testing a break of the downtrend line off the 2018 bottom. The sold put is below that 2018 low. The maximum profit is below the last high on the cycle down into the 2018 low.
Now, I have been invested in this ETF in the past. Its name is something of a misnomer as there is not a lot of Rare Earths in its mix at only 13.21%. The real elements are Strategic Metals as the name also says. The next table categorizes the holdings by sector and it also shows the change in mix since I last invested.
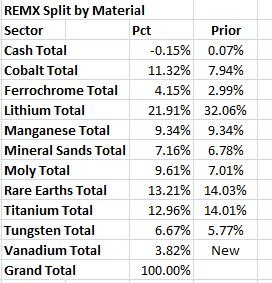
The largest components go into batteries and electric vehicles (lithium and cobalt) at 33% down from 40%. There is an important mix change here with more cobalt and less lithium. Other notable change is a bigger share for vanadium (now 4%).
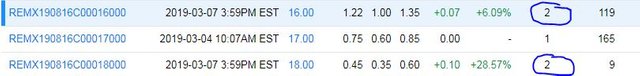
Last point about liquidity - the options chains show relatively low open interest and my trades were the only trades for the day at those strikes. I was impressed though to get hit with only 10 minutes to market close.
Western Digital Corporation (WDC): US Technology. With the big pullback in tech stocks, Western Digital share price dropped 2 strikes below the strikes I bought earlier in the week. That got me interested in the longer term opportunities I mentioned in TIB375. I bought a January 2021 47.5/62.5 bull call spread for a net premium of $4.50 offering a maximum profit potential of 233% for a 33% move up in price (closing price $46.99).
The updated chart shows the new trade as light blue and red rays with the extended expiry on the right hand margin. I have left in the Elliot Wave (12345 zigzag).
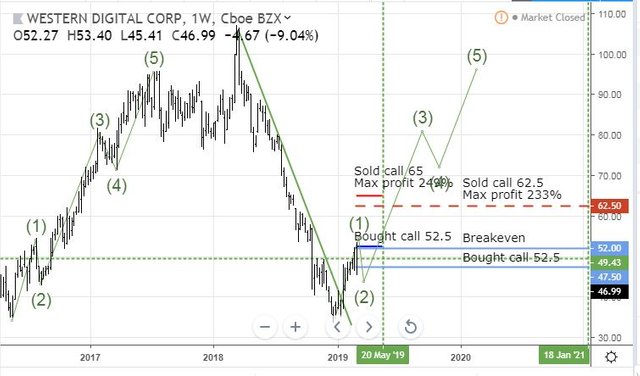
Breakeven on the trade is below Monday's high. Maximum profit this time is a little lower and is less than half way to the 2018 high. If the management team is right about the changes they have made and the trade discussions result in a deal, this should be comfortable.
Shorts
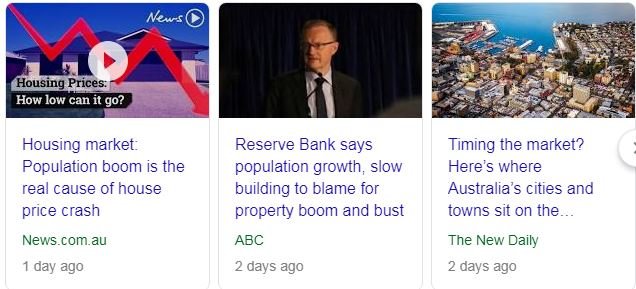
Westpac Banking Corporation (WBK): Australian Bank. The Reserve Bank of Australia intimated after its February meeting that the next rate change in Australia could be a rate cut. That surprised markets. In the month since, we have seen further softening in the housing market especially in the major metropolitan markets of Sydney and Melbourne.
This combination is never good for banking stocks, though a softening rate environment in foreign markets does help. Australian banks fund a lot of their mortgage book activity from foreign wholesale sources as their retail deposit bases are not large enough. Add in a Royal Commission which recently reported which has led to banks tightening a lot of their lending practices.
What I observe is all the banks pulling back to their core businesses, reducing exposure to foreign markets and also selling out their Wealth management businesses. These have become a nightmare of over-regulation. This suggests to me that profits have to come under pressure and their are no growth areas left to pull them up. A 12 month review of the top 4 banks shows ANZ (black bars) has performed best and is now just ahead of Commonwealth Bank (CBA.AX - yellow line).
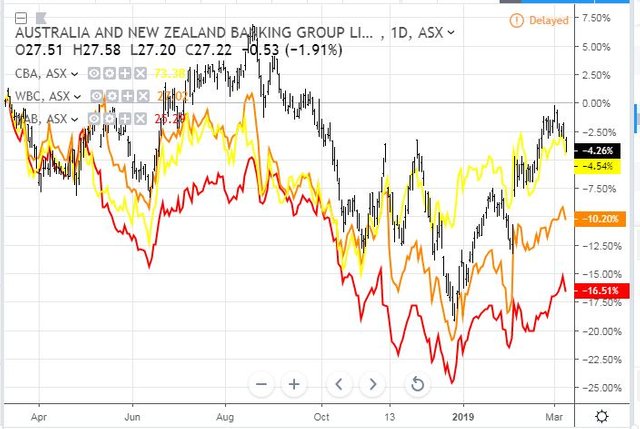
Furthest to fall is often a good way to choose a short stock - my wife works at ANZ so I cannot invest there. CBA share price is large which makes options trades expensive and I prefer to work in 100 share increments so I can cover a position with an options contract. I chose Westpac (WBC.AX - orange line) as next worst. Bottom bank is National Australia Bank (NAB.AX - red line) who just sacked Chairman and CEO (they resigned supposedly). Their bad news is baked in.
My thinking is constructing this as a long:short trade using the US listing for Westpac. I recently added Citigroup (C) as the long. This is the short. I would have preferred an options trade but options are not listed in US and are not liquid enough far out in time in Australia. Short trades like this carry stock borrowing costs and one has to pay the dividends (7.07% dividend yield). Over one year, I need the stock to drop more than a net 4.19% (net of Citigroup dividend) to be profitable. How does this look on a chart which shows last 12 months of Westpac (WBK - black bars) against Citigroup (C- blue line).
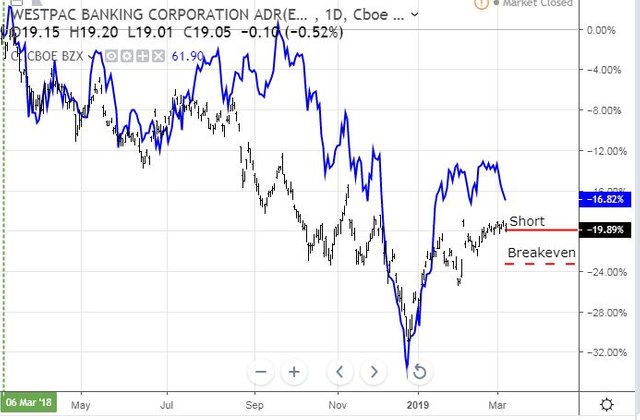
Citigroup has been on the right side of the long:short. The encouraging part is Westpac share price has held a level for the last few weeks while Citigroup has fallen. Westpac could well follow. The size of the Citigroup fall in March is 3.8% which is a little less than I need for the Westpac trade to make a profit. Breakeven for the trade (dotted red line) is above 2019 lows and well above the 2018 lows.
[Note: the breakeven is a full year target as dividends are paid out over a full year]
Cryptocurency
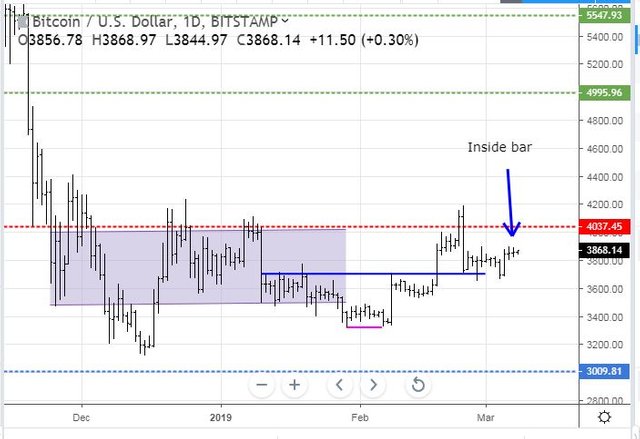
Bitcoin (BTCUSD): Price range for the day was $65 (1.7% of the low). Price makes an inside bar and shows no signs of what it wants to do.
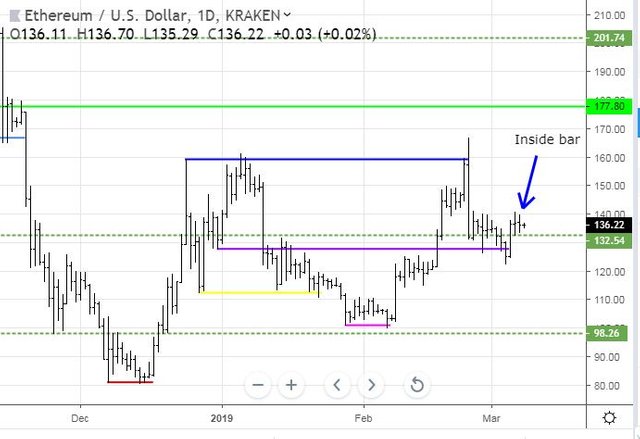
Ethereum (ETHUSD): Price range for the day was $6 (4.5% of the high low). Also an inside bar and holding above the long term support level of $132.
CryptoBots
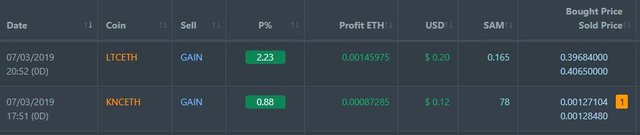
Outsourced Bot Weird stuff going on here. My account at Crypto World Evolution has gone past its one year marker. I did not renew and I would have assumed it would turn off the trading bot. It has not and a few trades appeared. I have now shut down the API access to the account - LESSON learned. Good news is it only closes trades at a profit. Bad news is I now have a new EOS trade to manage. Profitable trades on LTC (1.74% profit since June 2018) and new trade on NEO (1.63% profit). I checked the Bittrex account - no trades and API is shut down.
Profit Trailer Bot Two closed trades (1.56% profit) bringing the position on the account to 6.27% profit (was 6.23%) (not accounting for open trades).
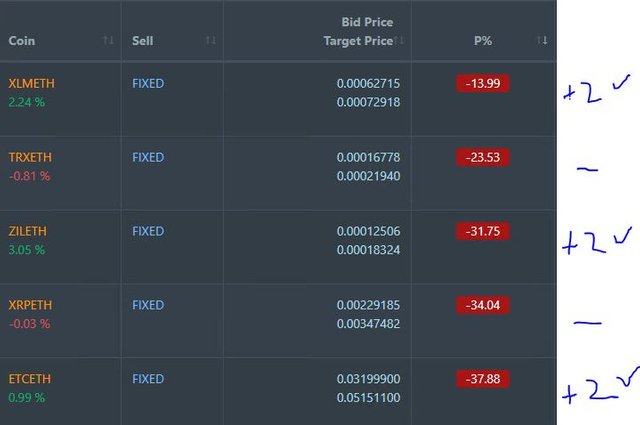
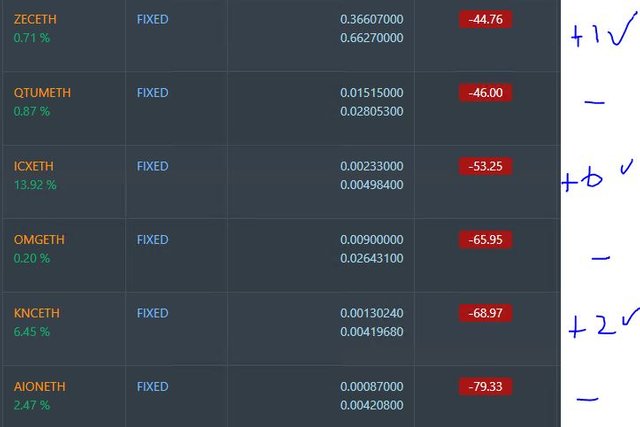
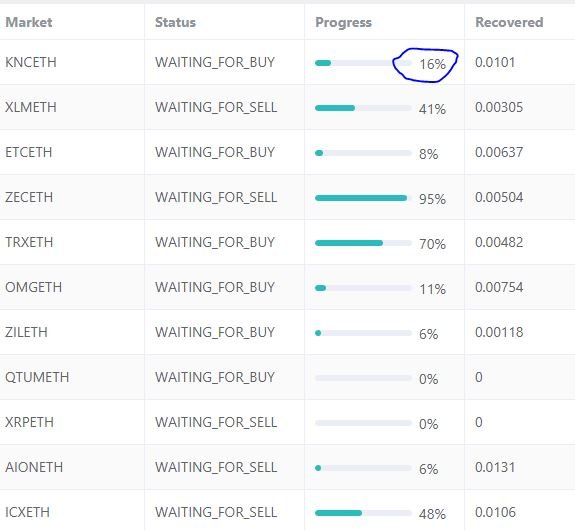
Dollar Cost Average (DCA) list drops to 3 coins with KNC moving off and onto profit after one level of DCA and ZEC dropping below the entry level. Big move from ICX
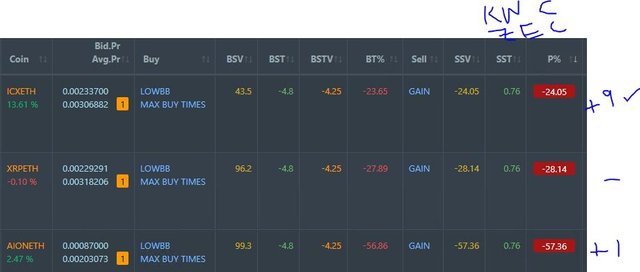
Pending list remains at 11 coins with 6 coins improving, 5 coins trading flat and 0 worse.
PT Defender continues defending 11 coins. Successful defence trade on KNC.
New Trading Bot Trading out using Crypto Prophecy. No closed trades.
Currency Trades
Outsourced MAM account Actions to Wealth closed out 4 trades (CHFJPY, AUDNZD, EURUSD)for 0.65% profits for the day. No open trades.
Cautions: This is not financial advice. You need to consider your own financial position and take your own advice before you follow any of my ideas
Images: I own the rights to use and edit the Buy Sell image. News headlines come from Google Search. All other images are created using my various trading and charting platforms. They are all my own work
Tickers: I monitor my portfolios using Yahoo Finance. The ticker symbols used are Yahoo Finance tickers
Charts: http://mymark.mx/TradingView - this is a free charting package. I have a Pro subscription to get access to real time forex prices
Crypto Trading: Trade the widest range of crypto at great spreads and low fees at Binance. https://mymark.mx/Binance
March 7, 2019
I was surprised to see that Rare Metals ETF be split in half despite high demand continuing in most products. May be a great to time to scale into a position for the long term.
Posted using Partiko iOS
Two things happening here:
Those steel tariffs have been a massive driver of industry and economic disruption. People talk about China but those steeel tariffs are the heart of the problem.
Thanks for sharing. No alt trading this week for you? ;)
Fully loaded with open trades. No new trades until they close unless I see a trade set up for Dollar cost averaging on the open trades.
As it happens the trading bot I thought was closed did trade. Closed an LTC, made a profit on NEO and opened an EOS.