TIB: Today I Bought (and Sold) - An Investors Journal #381 - Italian Insurance, Aircraft Manufacture, Australian Banks, US Technology
Markets drift again. Profit taking in Italy surprises and Europe delights. Detailed work (and a video) on a Boeing trade and more hedging work in Australian banks and Nasdaq

Portfolio News
Market Rally Stumbles
Markets drifted lower with news of a potential delay in US-China deal closure
Facebook faces a major outage though more damaging news is departure of another key executive - chief product officer.

Bought
The Boeing Company (BA): Aircraft Manufacturing. Boeing share price has dropped 12% since the Ethiopian Airlines crash and now following the grounding of the 737 Max-8 fleet. Implied volatility on short term options has jumped dramatically. This gives opportunity for spread trades and risk reversals to use the high volatility to fund some of the premium.
Stepping back Boeing has outperformed the S&P500 by 155 percentage points since the 2016 lows. The 737 Max 8 is an important driver of that outperformance with 5123 orders vs 350 actual deliveries. One has to believe that Boeing will sort out the problems with the aircraft and life will go back to normal. They have announced that they will continue production but halt deliveries until the problem is solved. Some customers will shift orders across to Airbus but Airbus will be limited in what they can produce.
https://en.wikipedia.org/wiki/List_of_Boeing_737_MAX_orders_and_deliveries
Investing thesis is the market reaction gives an entry opportunity and Boeing has sufficient cash reserves to fund delivery delays and any potential liability claims. Biggest risk is the aircraft requires a major redesign - market is not pricing that in.
Setting up options trades is predicated on choosing a timeframe. I have looked at two - June 2019 as that is after the next earnings announcements and January 2021 as that is as far out as options go and it gives enough time to solve the problems.
I have put together a detailed video of the thesis and the process steps outlining my thinking.
Table summarises my trades across two portfolios - buy bull call spread and sell an in-the-money put to fund the spread premium.
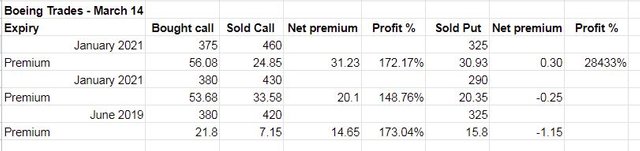
- One short term trade to recover price loss since the crash (380 to 420) with quite a tight sold put (355)
- One long term trade to trade price back to all time highs (375 to 460) with sold put below the mid 2018 lows (but above Q4 lows)
- One long term trade to recover price loss since the crash (380 to 430) but with sold put below December lows (290)
Let's look at the chart which shows the two long term trades with sold puts and sold calls marking the extremes of the trade range. One set uses red rays and the other pink rays.
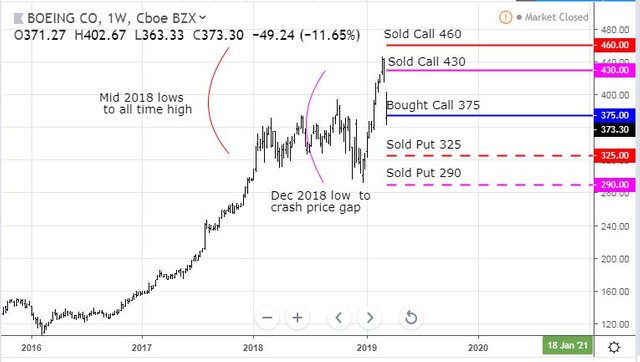
Key things to observe are the levels marked by the ellipses (red and pink to match the rays). Only one of these trades required a premium outlay. Risk in the trades are a calamitous drop in price below the sold puts and/or a calamitous drop in the whole market which drags Boeing down too. Riskiest trade is the short term trade if Boeing does not make meaningful progress within 3 months. They have been aiming for May delivery of software changes following Lion Air crash anyway. I expect they will deliver.
Sold
Asssicurazioni Generali S.p.A. (G.MI): Italian Insurance. I saw the next Italian Insurance company go into positive territory and I hit the exits for 3.4% profit since July 2017. Time to step back to the original thesis set out in TIB110. Two parts of that was insurance sector and Italy were to close the gap in financials. I compared then iShares Europe Insurance ETF (EXH5.DE - black bars) with Generali (orange line) - here is the updated chart nearly two years later (vertical green line is trade time).
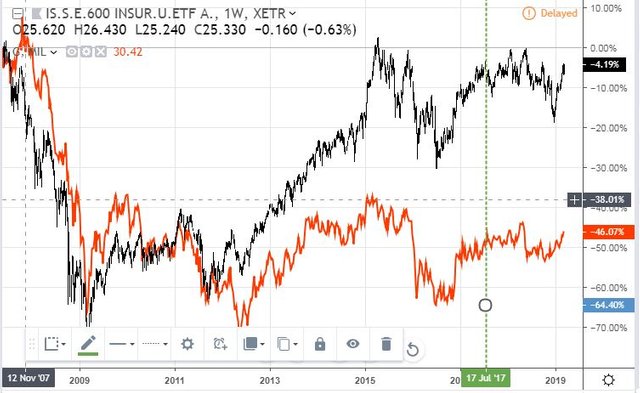
Both charts have gone nowhere and there has been no gap closing by Generali - exit time and look for better things. The trade idea was to pick the laggards in the iShares ETF and see what happened. Next chart takes the component stocks that I did invest in over the time of the Generali trade to test what actually did work
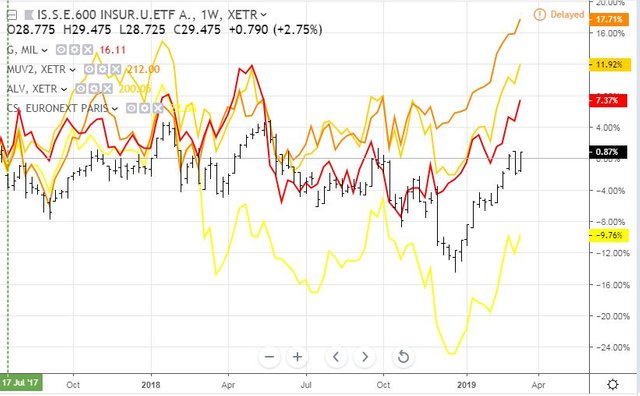
Over this time frame, Generali (red line) ended up ahead of the sector by 6 percentage points (black bars) but lagged Allianz (ALV.DE - ochre line) and Munich Re (MUV2.DE - orange line) and was ahead of Axa (CS.PA - yellow line).
Wisdom Tree Hedged Europe Equity UCITS ETF (HEDP.L): Partial fill completed. 11.5% profit since July 2016 in GBP terms - better in AUD terms. See TIB376 for discusion on first fill.
Shorts
Invesco QQQ Trust (QQQ): Nasdaq Index. Have now completed the ratio put spreads to hedge Nasdaq positions by selling May 2019 strike 154 put options. With closing price of $176.41 protection is now for a 14% drop in price. Maybe a smarter trade would have been to sell a put option at 10% protection rather than the same strike as prior sales.
Westpac Banking Corporation (WBK): Australian Bank. Added short position to the portfolio containing Citigroup (C) to set up the correct long:short trade. See TIB377 for the rationale
Expiring Options
Naked Puts Exposure Earlier this week I did put together a table of naked put exposure which has grown with the number of call spread risk reversal trades. This exposure is key as I will be found out having to buy a lot of stock if there is a major stock market correction
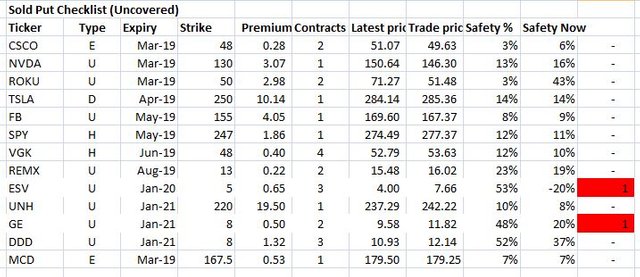
Key columns are Safety % and Safety now columns. I have put in a risk calculation that compares the two and highlighted the risk trades in red. Ensco, the oil driller (ESV) is a clear problem as price is below the sold put. General Electric (GE) is within the risk paramaters but this is after absorbing a lot of bad news. I will update this chart periodically
Next part is March expiries all look quite safe.
Cryptocurency
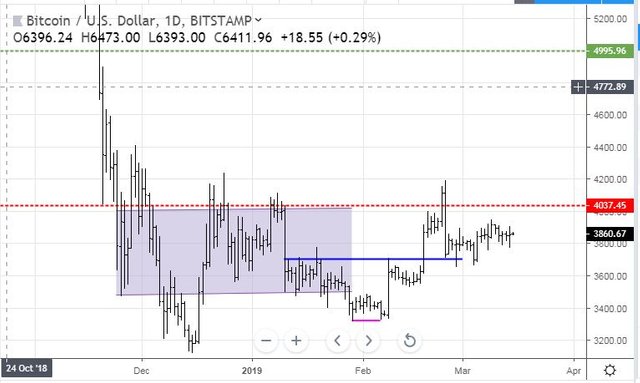
Bitcoin (BTCUSD): Price range for the day was $128 (3.3% of the open). Price traded in a wider range either side of the open and essentially going nowhere. It did make a lower low and not a higher high. Indecisive really
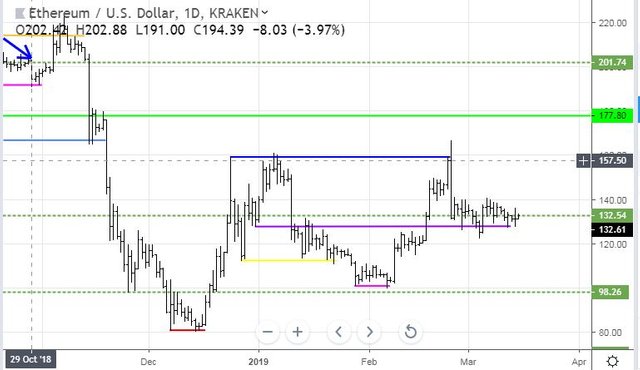
Ethereum (ETHUSD): Price range for the day was $8 (6.1% of the open). Price did much the same - wider range either side of the open BUT the low was not a lower low and closing above the long term resistance level of $132
CryptoBots
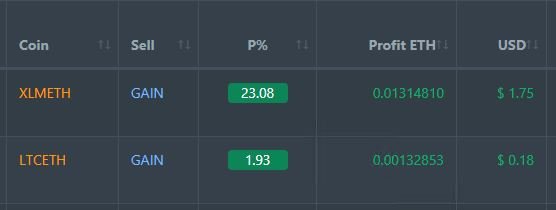
Profit Trailer Bot Two closed trades (12.51% profit) bringing the position on the account to 6.87% profit (was 6.61%) (not accounting for open trades). The XLM exit shows the value of trailing profit function in a robot - instead of just exiting when a target is hit
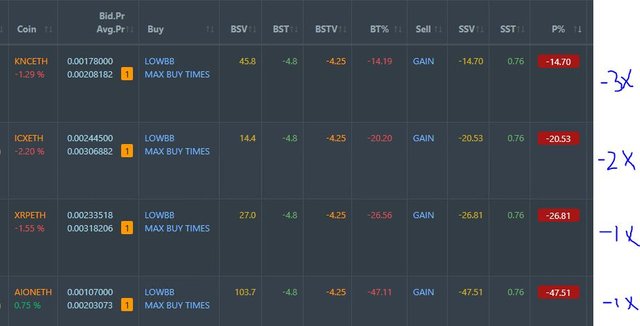
Dollar Cost Average (DCA) list remains at 4 coins all down
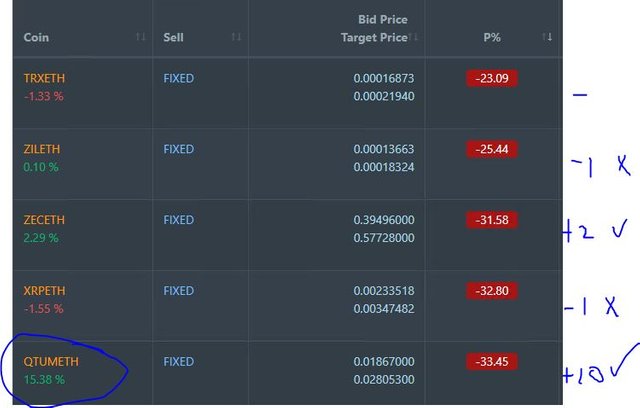
Pending list remains at 10 coins with 5 coins improving, 2 coins trading flat and 3 worse. Big jump in QTUM
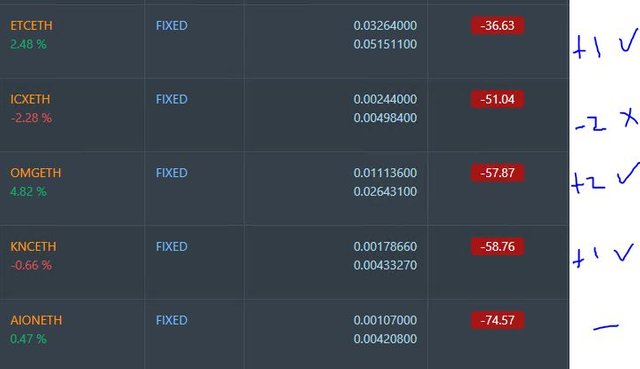
PT Defender continues defending 10 coins. No change.
New Trading Bot Trading out using Crypto Prophecy. No closed trades.
Currency Trades
Outsourced MAM account Actions to Wealth closed out 1 trade for 0.02% profits for the day. Trades remain open on AUDCAD (0.25% positive now)
Cautions: This is not financial advice. You need to consider your own financial position and take your own advice before you follow any of my ideas
Images: I own the rights to use and edit the Buy Sell image. News headlines come from Google Search. All other images are created using my various trading and charting platforms. They are all my own work
Tickers: I monitor my portfolios using Yahoo Finance. The ticker symbols used are Yahoo Finance tickers
Charts: http://mymark.mx/TradingView - this is a free charting package. I have a Pro subscription to get access to real time forex prices
March 14, 2019
Boeing setup is attractive but I think opportunities for better entries could come up as the noise tk the potential liability of this may spook the market and send it lower; which is when a value play can come into play.
Posted using Partiko iOS
My bias is long. There are equally short set ups for the short term bad news. It is possible to construct a ratio put spread with the sold puts at that key 290 level.
I am relying on the size of the balance sheet being able to absorb the liability hit. That is a long journey yet which for sure stretches out.