TIB: Today I Bought (and Sold) - An Investors Journal #395 - Mexico, Ride Sharing, US Technology, US Homebuilders, US Banks, TV Streaming, Bitcoin, Ethereum
US Markets inch a little higher though Asia was lower. Found a way to trade Lyft at no cost to me (some risk). Adding to TV streaming exposure and going short US banks again. Profit taking in technology rounds out a solid run for 3 years. A little more technology hedging with the proceeds.

Portfolio News
Market Rally
US market inched ahead despite noticeable drop in Boeing (BA) which has started to reduce production of 737 Max-8 aircraft
Rising oil prices does help the S&P500 index (oil is about 7% of it). Oil price driver is Libya unrest.

The headlines show the tussle between supply concerns (Libya) and demand concerns (slowing growth). There was one too about Russia saying they would only hold cuts until June - maybe one more chance to rollout my Russia call options expiring in two weeks.
Britain Bumbles
April 12 is looming and Theresa May flies to Berlin and Paris to seek another extension

UK Parliament rules out a no deal exit and the bill gets Rayal Assent. Her talks with the Labour Party drag on and her own party grow to dislike here even more.
Bought
iShares MSCI Mexico Capped ETF (EWW): Mexico Index. Averaged down entry price and rounded up small holding to 100 shares to allow me to write covered calls on the back of rising oil price.
Lyft, Inc (LYFT): Ride Sharing. Lyft represents a big disruptor to a number of industries (taxis and automotive). Their Initial Public Offering (IPO) attracted big attention and then price dropped off hard (down 19% from $88). There are a few things not to like about the business: strong competition from Uber; split shareholder voting structure protects incumbents (like Snap Inc structure) and a rich valuation on an unprofitable business.
There is a 6 month lockup clause for IPO shareholders which expires September 25. CNBC Options Action team presented a cash neutral way to hold a position past the time of lockup. Their idea was to buy October strike 75 call options and to fund that by selling strike 60 put options. The view was that options market was pricing in $68.50 target for October, which would make the 60 puts a safe enough place. The view was also that price was unlikely to break above the opening price around $88.
I looked at the options chains and wanted to find an entry price below the lows (say $50 to $55) and give away upside around the maximum price break (say $85). I constructed two call spread risk reversals - one is 75/85/55 and the other 75/85/50.
I bought an October 2019 75/85 bull call spread for net premium of $3.20 (offering profit potential on its own of 213%). I funded that premium by selling an October 2019 55 strike put for $5.15, bringing my net premium to a negative $1.95 - i.e., I get paid to make the trade. Risk in the trade lies in a strong correction in price or the markets that pushes price below $53.05. Against a closing price of $74.45, this would be price slippage of another 29%.
The other trade had a net premium of $3.04 (offering profit potential on its own of 216%). I funded that premium by selling an October 2019 50 strike put (more protection) for $3.35, bringing my net premium to a negative $0.31 - i.e., I was also paid to make the trade. Risk in the trade lies in a strong correction in price or the markets that pushes price below $49.69. Against a closing price of $74.45, this would be price slippage of another 33%.
With price closing another 2% down at $70.23, one could look at constructing a 70/85/50 call spread risk reversal - this gives a bit more upside (216% vs 213%) on the call spread.
Roku, Inc (ROKU): TV Streaming. Roku share price fell 4% following a broker downgrade with price dropping below the bottom of the range of the call spread I have on the stock. I added another call spread risk reversal contract for a net receipt of $0.90 per contract. This brings the average for both contracts to a net receipt of $0.65. Contract is a January 2021 65/80 bull call spread funded by a November 2019 45 put option.
Sold
Technology Select Sector SPDR Fund (XLK): US Technology. Price closed at $76.21 and has been above sold strike on January 2020 65/75 bull call spread for some time. Maximum profit potential achieved for 99% profit since November 2017. I continue to hold the stock in this portfolio. Have been rolling this trade along since December 2016 for 571% total profit.
SPDR S&P Homebuilders ETF (XHB): US Homebuilders. Rolled up June 2019 strike 38 call options to strike 41 call options locking in 98% profit in two weeks. I did something I do not normally do - I rolled up 1 for 2 contracts and was still able to bank $100 profits. With closing price of $40.39 this is one strike out-the-money. This trade was based on a CNBC Options Action idea - their suggestion was to take some profits and roll up as they felt lower interest rates would continue to underpin home demand.
I have updated the chart which shows the new contract as a pink ray with a 100% profit target. I have left in the blue arrow price scenario - price has moved steeper than that and is about at the top of that suggested level
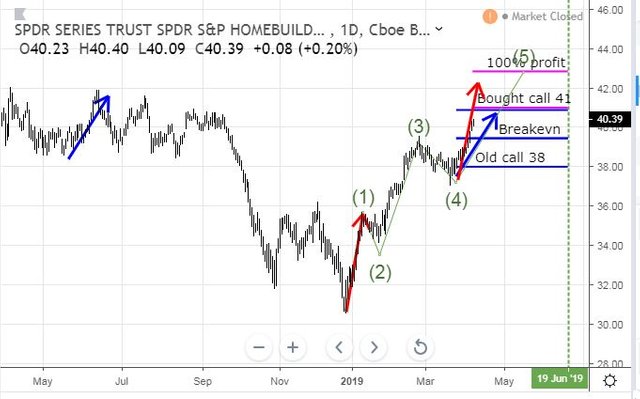
I have also started to draw in an Elliot Wave (green zig zag) with legs 1234 completed. There are 3 forecast levels for where wave 5 might end.
- Price has already passed the 1st (1.27 to 1.38 Fibonacci extension of wave 4).
- The length of wave 1 - the red arrow - which does not quite reach 100% profit
- 61% of the length of wave 1 to 3 takes price to 100% profit - which is where I have drawn leg 5 to.
The change of view the Federal Reserve made in January leans me to think option 3 will prevail (and maybe more). That is why I doubled up the number of contracts
Note: I did have finger trouble in one portfolio. I duplicated the trade from one portfolio to another and did not have the strike 38 calls to sell - so I am short. I will buy them back on the first possible pull back)
https://elliottwave-forecast.com/elliott-wave-theory/#relation-between-fibonacci-and-elliott-wave
Shorts
ProShares UltraPro Short QQQ ETF (SQQQ): Nasdaq Index. Added to my hedging position in one portfolio
Wells Fargo & Company (WFC): US Bank. Wells Fargo has been in the wars with the mis-selling problems and has under-performed its mainstream peers, JP Morgan (JPM) and Bank of America (BAC) over the last 12 months by 4% points. CNBC Options Action idea was that the problems will persist through earnings due on April 12 - the view was that earnings will bring some jolts for all the banking sector. I did review put options for the financial sector ETF (XLF) and for regional banks (KRE) before deciding to follow the idea on Wells Fargo. I bought a May 2019 47.5/45 bear put spread for a net premium of $0.60 offering maximum profit potential of 317% if price drops 8% from the $48.88 close.
Let's look at the chart which shows the bought put (47.5) and 100% profit as red rays and the sold put (45) as a blue ray with the expiry date the dotted green line on the right margin.
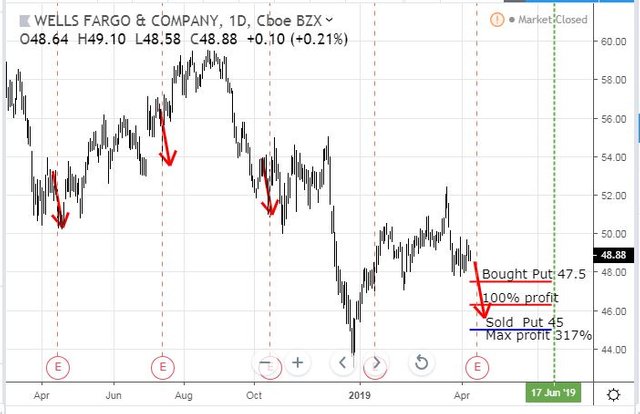
I have modelled in price moves down on earnings (3 out of the last 4 have been down and about the same size). Get a repeat of that move and the trade will make 100% profit comfortably but may not reach the maximum. The chart is a bit messy. One can easily argue for a continuing downtrend OR equally for a new uptrend from the December 2019 lows. The lowering interest rate environment is not good for net interest margin - so I am leaning toward the next high being a lower high.
Income Trades
I continue to add income trades with 2 weeks to go to expiry
JPMorgan Chase & Co (JPM): US Bank. Sold April 2019 strike 110 calls for 0.24% premium (0.25% to purchase price). Closing price $105.31 (new trade). Price needs to move another 4.5% to reach the sold strike (new trade). Should price pass the sold strike I book a 9% capital gain.
Petróleo Brasileiro S.A. (PBR): Brazilian Oil. Sold April 2019 strike 17.5 calls for 1.03% premium (1.61% to purchase price). Closing price $16.50 (new trade). Price needs to move another 6.1% to reach the sold strike (new trade). Should price pass the sold strike I book a 66% capital gain.
Cryptocurency
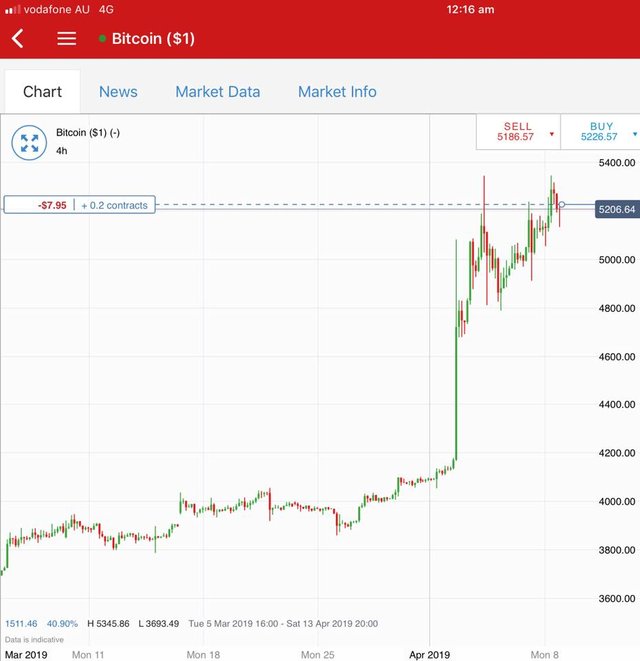
Bitcoin (BTCUSD): Price range for the day was $220 (4.3% of the low). Price pushed to just make a new high at $5347. Do not be surprised to see a rest and pullback from here as momentum indicator is strongly overbought (lower window is highest for the whole chart)
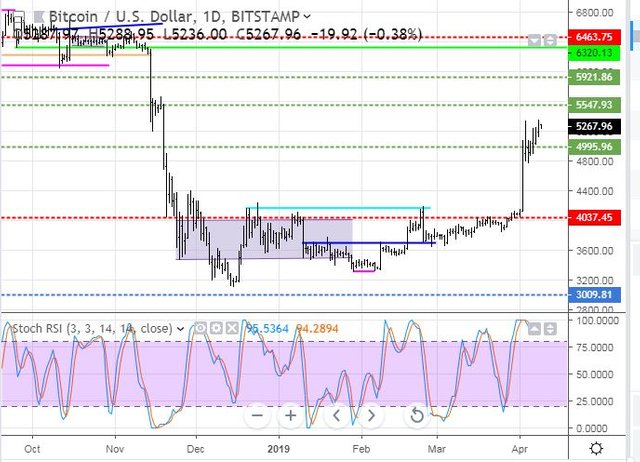
I added one new contract in my IG markets account based on a 4 hour reversal. I have put a take profit target around the next resistance level up (dotted line)
Ethereum (ETHUSD): Price range for the day was $16 (9.2% of the low). Price spiked above the resistance level and closed above. Momentum indicator is in overbought territory but its high was not the highest like Bitcoin was.
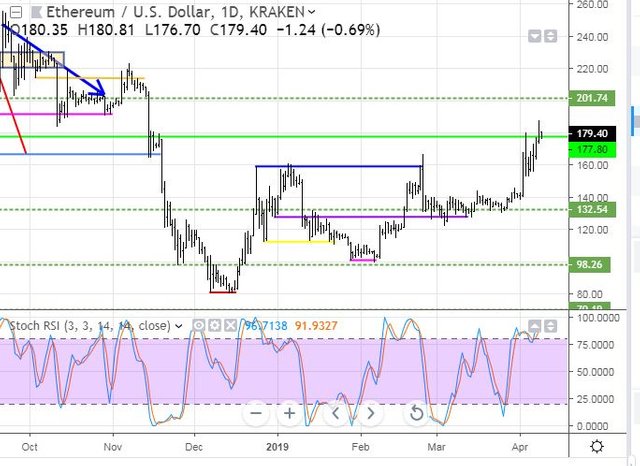
I trailed the stop loss on my last contract which was hit for a $5.96 per contract profit (3.5%). I replaced that with a new contract on a 4 hour reversal
CryptoBots
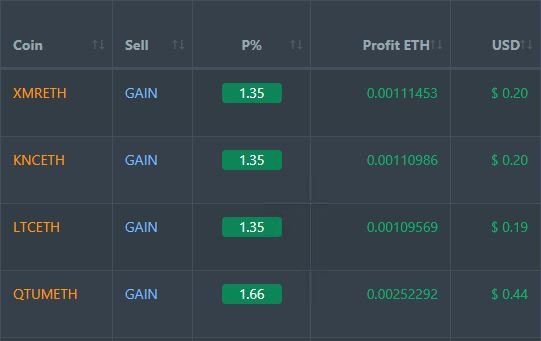
Profit Trailer Bot Four closed trades (1.43% profit) bringing the position on the account to 7.92% profit (was 7.82%) (not accounting for open trades). 3 out of 4 trades are PT Defender trades (LTC was not). I added XMR and TRX to PT Defender duties.
Updates on DCA and pending once a week from now.
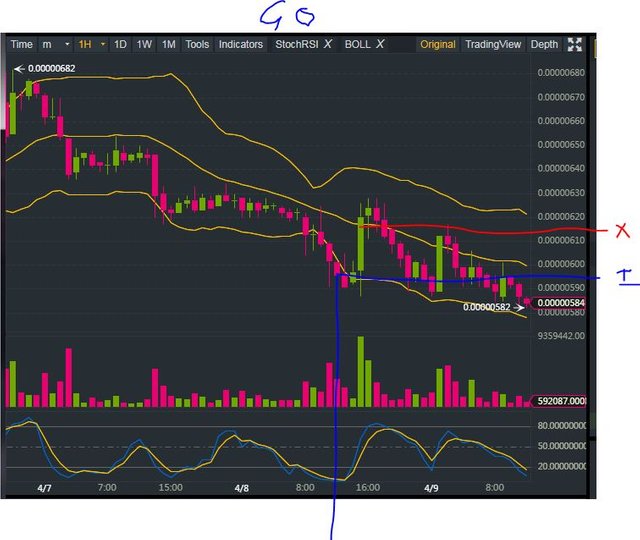
New Trading Bot Trading out using Crypto Prophecy. Trade closed on GO (1.83%). Signal may have been early but confirmation of oversold state from Crypto Prophecy made up for that. Patient trader would have waited for confirmed stochastic crossover signal (lower window). Trades open on XLM, SC and VET.
Currency Trades
Outsourced MAM account No closed trades. One open trade short on AUDNZD (0.42% negative)
Cautions: This is not financial advice. You need to consider your own financial position and take your own advice before you follow any of my ideas
Images: I own the rights to use and edit the Buy Sell image. News headlines come from Google Search. All other images are created using my various trading and charting platforms. They are all my own work
Tickers: I monitor my portfolios using Yahoo Finance. The ticker symbols used are Yahoo Finance tickers
Charts: http://mymark.mx/TradingView - this is a free charting package. I have a Pro subscription to get access to real time forex prices
Bitcoin: Get started with mining Bitcoin for as little as $25 http://mymark.mx/Galaxy
Crypto Prophecy provides a useful tool to identify oversold and overbought coins - used for the GO trade win https://mymark.mx/CryptoProphecy
Trading: Binance offers a wide range of coins to trade, tight spreads and low fees if you use BNB to pay https://mymark.mx/Binance
April 8, 2019

Quite a setup on Lyft! It will be interesting to see how other Unicorns get priced in this market. I also think that the buying in these new IPOs could be a drag to the market as it could dilute interest in existing stocks.
Posted using Partiko iOS
I agree and I think we will also see a lot of churn as people wash in and out of their pet IPO's.
I am keen to be involved in the whole ride sharing idea BUT I do not like the idea of holding the stock just yet.
Nice analysis and explanation on Lyft.
Thanks.