Investment Advices and Strategies
When you invest it is important that you have a clear strategy and follow that one. Otherwise you will make emotional calls that cause you buy at the top during the hype and sell at the lows in the bear. Nobody knows what will happen and a rational analysis beats spontaneous buying.
People always think what if I had bought at the low of 200$ and then sold at 20000$, turning 10.000$ into a million. But nobody does that. And if you want to at least come close you need solid analysis.

Below I summarise different methods for investment and give my opinion. Then I present my current strategy and why I think it beats all other options for me personally. But there are tradeoffs and what works for me may not be good for you. So please do not take this as financial advice and invest at your own decisions.
Technical Analysis
TA is very popular and by far most posts on investment are about TA. The idea is finding patterns in the prices and expect those to repeat (at least approximately). TA does not consider any fundamentals. It is just looking at the price history and extrapolating that. I can make TA for BTC, the dow, gold or anything, I dont even have to know what the underlying asset is.
The reason why it works is that prices are made by humans. And humans are not optimal players. In a hype they fomo in. In a crash they fomo out. TA tries to make use of this irrational herd mentality and uses different indicators to find psychological imprints on all timescales.
There are however some fundamental problems why TA is often highly overrated. Below I have generated an exponential random walk. This graph has absolutely no structure. There are no periodic patterns in it. The future does not depend in any way on the past.
.png)
Seems like there is strong support at the 0.8 level and a drop to the 2 level is due short term followed by a rise to about 4? Maybe, but the reality is that the future of this graph is completely random and there is no possible prediction that is better than "It will do something random around the current price levels."
The problem is that most stocks and other prices look a lot like an exponential random walk. Overlaid only by tiny fluctuations of human irrationality that can be predictively exploited. And the reason is that big human irrationality is already being exploited by smarter investors and that removes this opportunity from the market. If you want to win in TA you have to beat the other market participants or fall prey yourself if your strategy is weak.
The second problem is that the people we hear most are the ones that win; the losers are silent. When you play this game of huge randomness then just by luck 1% will make huge fortunes. And these then talk about their genius ideas that are nothing but bullshit. Others make 25 strategies on test portfolios and then post about the best one but never mention the failed ideas.
If you are interested you can follow my attempts to make TA via a neural network here. This network always finds tiny optimisations, but compared to just holding the expected advantage is very small. It is currently down a little, but this is perfectly in line with the randomness.
S-curve adoption
There are some techniques taking some info beyond the price to make better models. Most prominently the S-curve adoption of new technologies.
The idea is that a new technology starts with an exponential expansion into the empty field and then slows down as it reaches 100% adoption (looking like an S). Below some historical S-curves where the lower part is often cut of since nobody was collecting good data about this initially.
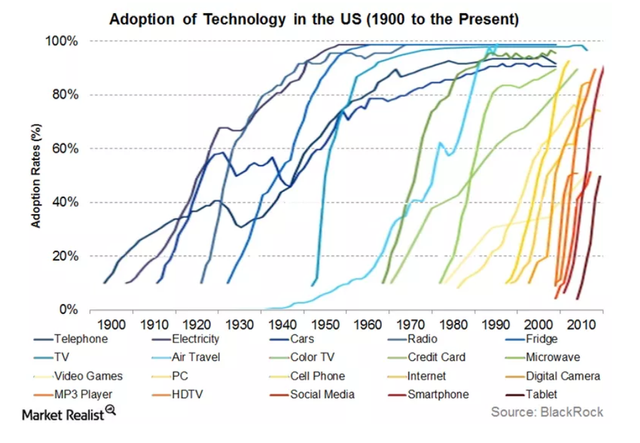
source
What you notice is that these are not clean S-curves but only roughly resemble them. There are few open parameters to fit them, mostly the time from 0 to 20%, the time from 20% to 80% and the time from 80% to 99%. And these are not very much correlated.
The bitcoin theory is that BTC is following such a S-curve adoption and the price follows the adoption curve. Then btc price is fit to an idealised S-curve (often in logspace). But this has a few fatal flaws. First we only know the very start of the adoption curve and from there we cannot reliably (almost not at all!) predict when the big takeoff will happen and more importantly if it will happen at all. Because there were many technologies that went to 10% and then did not develop such an S-curve but stagnated or failed.
Also this fit is a one-parameter fit and the resulting adoption of crypto should already be close to 10%. But this is simply not the case. So we even know the fit is not accurate.
I can fit the current BTC adoption curve to almost any S-curve I want when using more than one parameter. In essence I learn very little from this exercise. What I do is only stating that I believe that BTC will go mainstream and that this causes a big price move. Thats all. The rest is just math to hide it and make me look smart.
Fundamentals
This is looking at the asset, making expectations for growth, adoption and technology and then come up with a price forecast. It is hard work and subject to large errors, but this is the best way to make good investments.
Fundamental analysis uses the idea that in the long run all assets converge to their fundamental value and small fluctuations average out. We know that fluctuations exist on all timescales, so fundamental analysis always require a long perspective. And always keep in mind that markets can stay irrational longer than you can stay solvent.
How to build a reasonable strategy?
As I made it clear above, I am favouring an analysis of Fundamentals. I will look at a case where I am just investing into two assets, but the idea can be generalised. I am also assuming that these assets are not correlated, which is not the case for multiple cryptos, but again this can be included. Here I will consider BTC and Fiat USD. I want to find a strategy that tells me how much of my portfolio should be in BTC and how much in Fiat.
I want to invest with a timeframe of roughly 3 years or for simplicity 1028 days. I make a fundamental analysis estimating what a BTC should be worth after that time, neglecting any market cycles. This could be around the 100000$ levels for example.
But I don't know if that will actually happen. To model the risk I take the past volatility of BTC and extrapolate into the future. Historically the daily variance of BTC has been 0.00155 so I will use this value. I then assume that the daily gains are described by a Gaussian around the past value with this variance and a mean growth to match my expectation. This gives a PDF for the BTC price tomorrow. Then I can fold this PDF many times to get a realistic BTC price forecast after 1024 days.
The final PDF becomes almost independent of these assumptions and it gives a quite solid guess where BTC could be after this timeframe.
.png)
The blue line is the price after 8 days, the orange after 128 and the green after 1024 days, assuming an initial price of 1. After 8 days the price expectation is still symmetric around 1. Then as time moves on it becomes very asymmetric with a large chance for looses but a long tail with huge gains.
Then I can again fold this PDF with the PDF for holding fiat depending on the fraction that I invest in BTC. By choosing the fraction of BTC I can design my final PDF and the question is which PDF do I want for my investment. What is the correct risk to take? How much profits to trade for security?
This is a very individual questions that depends on the needs that you have. Do you want safety to protect your assets? Do you need a lot of money to realise some projects?
In order to proceed we need a utility function that describes the personal use case for that amount of money. This takes into account that with the money you have will buy the most useful items first. When you have twice the money you naturally use that to buy less useful items. Typically the utility should decay exponentially with the amount of money that you have where you eventually end up having soo much money that you have no more idea what to spend it on. If you have specific goals you can add step-functions at these threshold levels (such as buying a house).
A reasonable utility function could look something like this:
.png)
Initially the function rises linear, but as I approach 1 million $ there are fewer urgent things to buy and it slowly starts flattens out. Note that the normalisation is not meaningful.
Then happiness does not go linear with utility but logarithmic. So I will take the log of that function to specify how much that money means to me in practical terms. Now I can compute the averaged happiness along the predicted PDF's. This is a method that helps to weight risks versus rewards. Is it worth risking a total loss for the chance of 10x gains? That depends on your situation and once you agree on your utility function and the PDF you can compute what is objectively the optimum.
Let us take a simple example in practice. We expect that in 1024 days BTC should be roughly at 26000$. We have a capital of 10000$. We can without big problems earn back 1000$ in case of total loss. We have solid plans for our gains up to roughly half a million. After that we start to go a lot into luxuries. We assume short term gaussian fluctuations and that past volatility remains approximately constant. Lots of assumptions, but given these we can now accurately and objectively state what the optimal strategy for investment between BTC and fiat is.
In this case the achieved average happiness as a function of % in BTS is
.png)
which slows down a little but prefers 100% BTC and 0% fiat! Using such a huge growth expectation clearly beats the risk. There are many cases where this results in heavy losses but this is outweighed by the futures where a lot of money was made. Note that this depends on your personal utility functions and the assumptions above, so dont think this means that you should put everything into BTC! It is just an example for the method.
Lets go for a more conservative case. We keep everything as above but only expect BTC to hit the 8000$ levels. Then the graph looks like this
.png)
telling us that a mixture of 60% crypto and 40% fiat is optimal balancing risks and rewards.
In general there will be a higher crypto allocation the more optimistic and the lower the volatility is. Unless of course in your utility function you state that you need a certain amount of money in which case this methods takes more risks trying to achieve that goal.
Outcomes
What makes these strategies a very solid plan is that you tend to buy on the fall and sell on the rise. When I decide to put 50% crypto and 50% fiat for example then on the way down I have to rebuy to balance the portfolio and on the way up I sell. Even though it involves no try to catch bottoms or tops, naturally more coins are bought at low prices and sold at higher ones. Also given that your expectation does not follow the market cycle you will automatically have a higher % in crypto after the cycle and a lower % the higher the price moves.
There is no optimal strategy, but having a reasonable one is very important. Try to make simple assumptions and then stick to them.
This post is promoted by @reversed-bidbot as an upvote lottery with a jackpot of 0.500 steem!
There are still up to 2500 tickets waiting to be distributed.
Tickets are distributed according to the value of your upvotes with a multiplier of 1500.0.
Upvote the post to participate and claim your tickets!
Excluded from participation are: bidbots, autovoters.
The jackpot is paid in redfish_shares by @curatorbot, giving you lifetime upvotes while supporting the redfish community. Find more information here.
Follow me to also earn steem on my other promoted posts; or use @reversed-bidbot to hold your own raffles. For more details please visit my discord server or read my introduction post
Awesome article. I'm bookmarking it to read more carefully later on. Thanks for your great work. 😉
This post was shared in the Curation Collective Discord community for curators, and upvoted and resteemed by the @c-squared community account after manual review.
@c-squared runs a community witness. Please consider using one of your witness votes on us here
Thanks for this great article and especially your honest style :)
The end pretty much summarized my strategy :D
But I also learned that informing is key.
Especially about cryptos.
Posted using Partiko Android
I like your state of mind and I want to take care of what you have written.
Thank you and Sttem on!
Posted using Partiko Android
@frdem3dot0 Thank you for not using bidbots on this post and also using the #nobidbot tag!
Hi @frdem3dot0!
Your post was upvoted by @steem-ua, new Steem dApp, using UserAuthority for algorithmic post curation!
Your UA account score is currently 3.563 which ranks you at #6022 across all Steem accounts.
Your rank has improved 31 places in the last three days (old rank 6053).
In our last Algorithmic Curation Round, consisting of 471 contributions, your post is ranked at #168.
Evaluation of your UA score:
Feel free to join our @steem-ua Discord server
Congratulations! This post has been upvoted from the communal account, @minnowsupport, by frdem3dot0 from the Minnow Support Project. It's a witness project run by aggroed, ausbitbank, teamsteem, someguy123, neoxian, followbtcnews, and netuoso. The goal is to help Steemit grow by supporting Minnows. Please find us at the Peace, Abundance, and Liberty Network (PALnet) Discord Channel. It's a completely public and open space to all members of the Steemit community who voluntarily choose to be there.
If you would like to delegate to the Minnow Support Project you can do so by clicking on the following links: 50SP, 100SP, 250SP, 500SP, 1000SP, 5000SP.
Be sure to leave at least 50SP undelegated on your account.