The collapse of BITcoin and ETHereum [ ENG ] / Il crollo di BITcoin e ETHereum [ ITA ]
CRYPTOCURRENCY

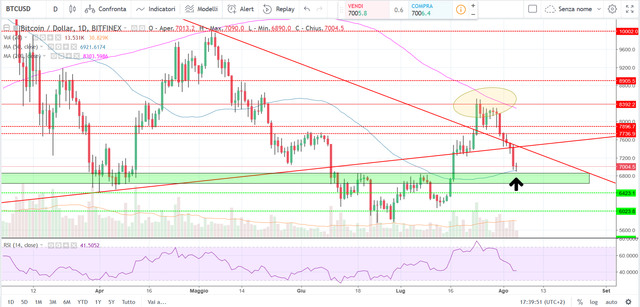
BITCOIN CHART 1D
| ITALIANO | ENGLISH |
|---|

In the last article we saw to come it was possible to see a further fall compared to that in the area 7,400 $. I also ventured the hypothesis of a return to the neckline in the $ 6,800 area.
This descent took place very quickly and decisively. Until the moment when the price does not fall below the green support area we can still face an uptrend.
I say this because it would create a new higher relative minimum that can start a new upward impulse up to $ 9,000
I pointed to the arrow for today because it can be a great place to start the trend again for reasons:
Presence of very important support exposure in the past;
At that point there is a 50-period moving average that works as a dynamic support.
It must also be said that they have greatly increased the sale of Bitcoin and the market in general, and this is never a good sign.

Nello scorso articolo abbiamo visto di come era possibile vedere un ribasso ulteriore rispetto a quello in area 7.400$. Avevo anche azzardato l'ipotesi di un ritorno alla neckline in area 6.800$ .
Questa discesa è avvenuta in maniera molto veloce e decisa . Fino al momento in cui il prezzo non scende al di sotto dell'area verde di supporto possiamo ancora essere di fronte ad un trend rialzista .
Dico questo perchè si andrebbe a creare un nuovo minimo relativo più alto che può dar inizio ad un nuovo impulso rialzista fino ai 9.000$
Ho indicato dalla freccia la candela di oggi perchè può essere un ottimo punto da cui far ripartire il trend per due motivi :
Presenza di un'area di supporto molto importante in passato;
In quel punto è presente la media mobile a 50 periodi che funziona da supporto dinamico.
Bisogna anche dire che sono aumentati di molto i volumi in vendita del Bitcoin e in generale del mercato e questo non è mai un buon segno.

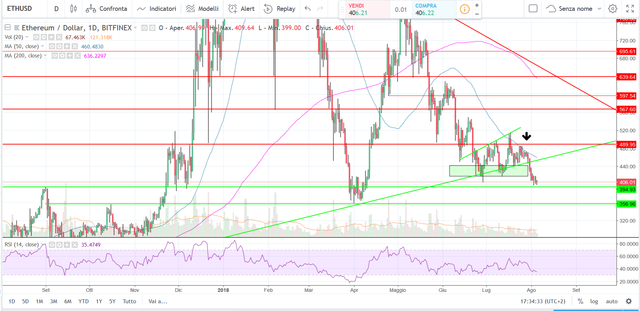
ETHEREUM CHART 1D
| ITALIANO | ENGLISH |
|---|
On the Ethereum a megaphone was formed which had above the resistance at 490 $ and below the support angle with an amplitude of about 400 rpm.
A megaphone in technical analysis is a figure that warns of a strong collapse because the volatility is high and is not sustainable for a long time considering that the width of this channel is widening more and more.
At the point marked by the arrow there is a resistance jerk, ie the 50-period moving average which acts as a dynamic resistance and the static resistance at 490 $.
This price offered Ethereum the opportunity to come back down strongly, also breaking the green support area. Now the quotations are on a new important support level at $ 395.
At $ 395, we could see a rebound and a resumption of quotations, which may start a period of lateralisation and reach $ 450.
Su Ethereum si era formato un megafono che aveva sopra la resistenza a 490$ e sotto un'area di supporto con un'ampiezza di circa 400 dollari.
Un megafono ascendente in analisi tecnica è una figura che preavvisa un forte crollo perchè la volatilità è alta e non è sostenibile per molto tempo se si considera che l'ampiezza di questo canale si allarga sempre di più.
Nel punto segnato dalla freccia c'era una dobbia resistenza , ovvero la media mobile a 50 periodi che funge da resistenza dinamica e la resistenza a 490$ statica.
Questo prezzo ha offerto l'occasione ad Ethereum di tornare giù con forza rompendo anche l'area di supporto in verde. Ora le quotazioni si trovano su un nuovo livello di supporto importante a 395$.
A 395$ potremmo assistere ad un rimbalzo e ad una ripresa delle quotazioni che se pur debole può dare inizio ad un periodo di lateralizzazione e ad un raggiungimento dei 450$.

Se sei interessato a questo tipo di articoli lascia un commento e seguimi alla mia pagina @giu-marcantuono.
Fonte immagini:
Tradingview
https://pixabay.com/it/divisore-separatori-colorato-design-2461548/
https://pixabay.com/it/mappa-regno-unito-bandiera-bordi-1019896/
https://pixabay.com/it/londra-bandiera-del-regno-unito-1443715/
https://pixabay.com/it/bitcoin-crypto-moneta-valuta-denaro-2643159/
https://pixabay.com/it/astratto-decorativi-divisore-3166168/
I am not a financial advisor and these are not financial advice. These are only my opinions and my analyzes, none of which is an incentive or an encouragement to invest
Io non sono un consulente finanziario e questi non sono consigli finanziari. Sono soltanto i miei pareri e le mie analisi, nessuno di questi è un incentivo o un incoraggiamento all'investimento.
Articoli correlati / Other articles :
https://steemit.com/ita/@giu-marcantuono/apple-vs-amazon-chi-arrivera-prima-al-bilione-di-capitalizzazione
https://steemit.com/ita/@giu-marcantuono/ethereum-e-in-una-fase-laterale-eth
https://steemit.com/ita/@giu-marcantuono/il-rialzo-sul-bitcoin-e-finito