Mass murders in the United States:
Introduction:
Mass murders have become an increasingly common occurrence in America, or it seems that way to many, myself included. I feel as though I hear about one, once a month or more. So after the last large mass murder in Vegas it’s been in the back of my mind to do a little research into the subject. I never have until recently. I didn’t have a research question and I wasn’t really trying to analyze anything. I was just planning to look over the data and sort of see what I found. And I think I found some interesting trends.
But first, I got the data from Kaggle.com, it’s a website for data scientists with a massive collection of well-kept data sets for download and analyzation, either on the website or from your own computer. It’s a cool website and offers tutorials for various data languages like R. Anyways, here’s the source:
https://www.kaggle.com/zusmani/us-mass-shootings-last-50-years#=
The data:
“Mass Shootings in the United States of America (1966-2017) The US has witnessed 398 mass shootings in last 50 years that resulted in 1,996 deaths and 2,488 injured. The latest and the worst mass shooting of October 2, 2017 killed 58 and injured 515 so far. The number of people injured in this attack is more than the number of people injured in all mass shootings of 2015 and 2016 combined. The average number of mass shootings per year is 7 for the last 50 years that would claim 39 lives and 48 injured per year.”
Time period: 1966-2017
Mass shootings is defined as 3 or more victims in this data set.
Some of the variables within the data set were:
Total victims, incident area (where it the shooting took place), open/close location (inside a building or in an open space), target, cause, police killed, age, employment status, employed at, total fatalities, total injured, race, ect. There’s quite a few variables. I’m hoping that the coming visual representations of the data will help us all better understand this terrible subject matter in greater depth. After all, we can’t have a educated discourse on the subject without knowing what the data can tell us.
insights:
The first thing I did was just use the summary command in R and look at the average, min, max, and percentiles for the major quantitative variables. Here’s the results:
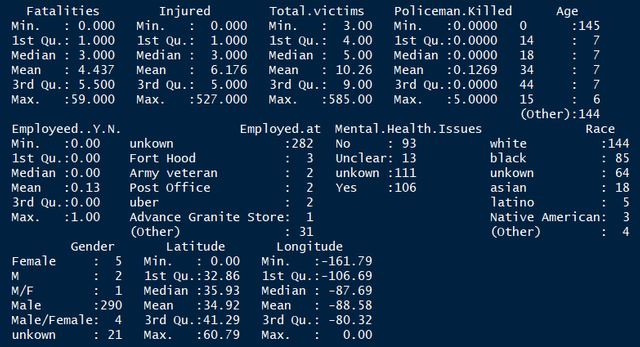
Just from looking at this you can tell a few things. First not many police officers are killed during mass shootings, the average is 0.1269 and the max is only 5 killed in action – that was the Dallas shooting at black lives matter. Meanwhile, innocent people are targeted much more often than police officers. The fatalities, injured, and total victims are all magnitudes higher than the amount of police killed. Finally, we can also see, under gender that it’s mostly males committing these atrocities.
Next the data set contained a variable called “Cause” with words under it for the reported reason for the shooter committing the murders. I jumped into PowerBi and ran a word cloud:
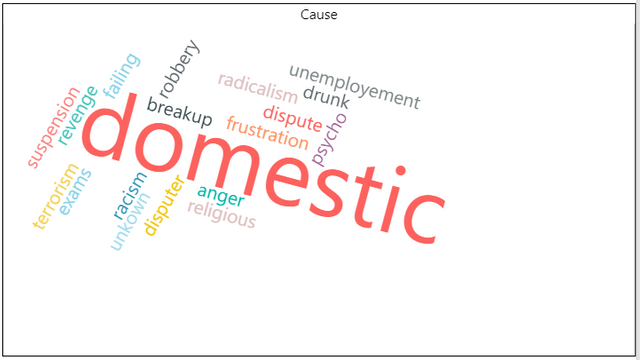
This was interesting as I expected more terrorist related activity. While we see radicalism as one of the cited causes it’s far more likely that the cause will be a domestic dispute than terrorism. But among some of the other common reasons are normal, vexing human problems like breakup, anger, racism, or even exams. This would seem to suggest that these people tend to not process human emotions the same way regular people do. Not being able to deal with the stress life hands them in a healthy way, so they resort to extreme violence.
To add to this I decided to explore the mental health variable a little more:
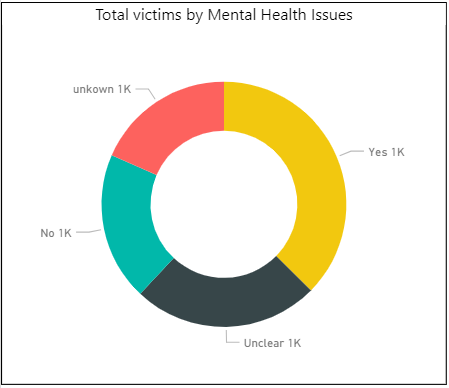
Unfortunately, there was a lot of the data that was unknown or had zeros/missing values. But the “Yes” category represents 37%, “Unknown” represents 18%, “No” represents 19.55%, and “Unclear” represents 24.59%. The “Yes” category is the biggest category and I think it’s safe to assume that some in the “Unknown” would be placed into the “Yes” category. I think it’s probably safe to say that there is statistical significance between the total number of victims and mental health. But without running a regression and using a hypothesis test that’s just my intuition.
Then I decided to add in race, mental health, and total injured:
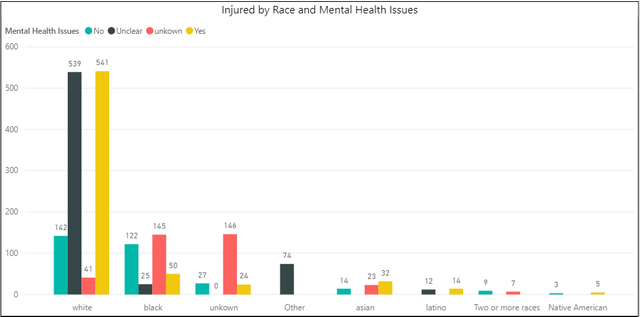
The race category was split up into 8 categorizes as you can see how it’s denoted at the bottom of the above chart. It looks like Whites are, far and away, the leading perpetrators of mass shootings in America. That’s across all mental health categories too, except for unknown. That seems to fly in the face of right wing media trying to tell us that it’s mostly “terrorists” or “Muslims.”
I was surprised that whites were committing so many killings, so I decided to create a pie chart to see the percentages (sadly, I couldn’t figure out how to display the percentages properly on powerbi):
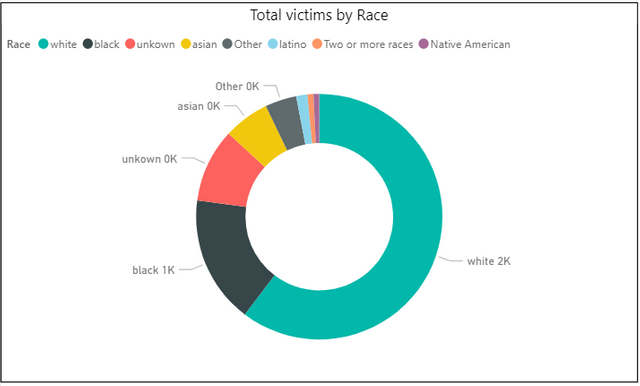
But whites are responsible for 60.36% of the total victims with blacks far behind at 16.77% and the rest make up smaller percentages.
Then I started looking at totals:
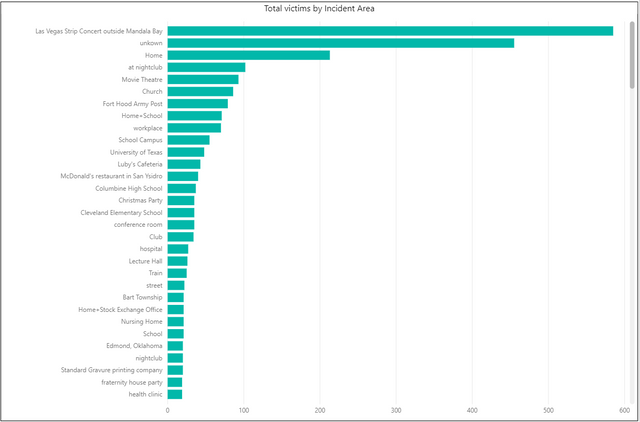
I looked at the incident area to see if there was any place you might be safe… and it looks like there really isn’t anywhere. The top ten include: home, church, schools, theaters, and night clubs. Seems random. Note: The full list isn’t included as I didn’t bother to take a picture of the smaller shootings.
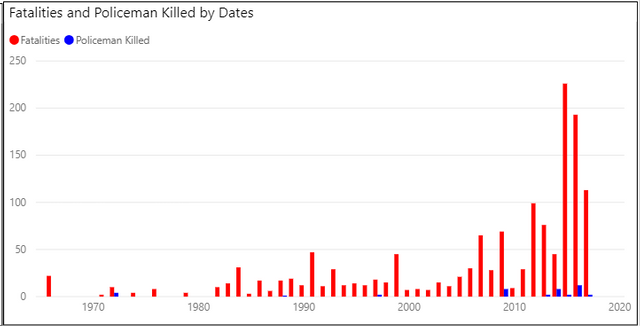
Next there is clearly an uptrend in mass shootings from the beginning of the data set. The total number of victims, fatalities, and policemen killed seems to be rising. Although, there is hope. The total victims increased again last year, for the third year in a row. But the number of fatalities dropped even with the deadliest mass shooting occurring last year.
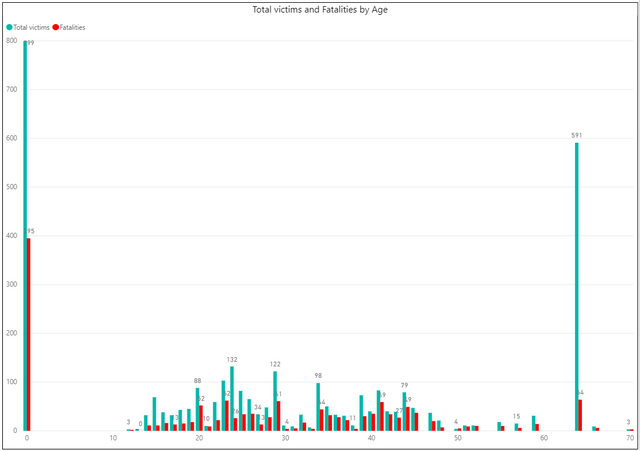
Then I decided to explore age a little bit. Unfortunately, there is a lot of missing data in the data set so it has a large portion of the mass shooters as being age zero. Although, baring the “zero” aged killers, the victims and fatalities seems to be normally distributed with a large outlier.
Finally, I decided to look at employment, stated target, and the location variables.
First, employment:
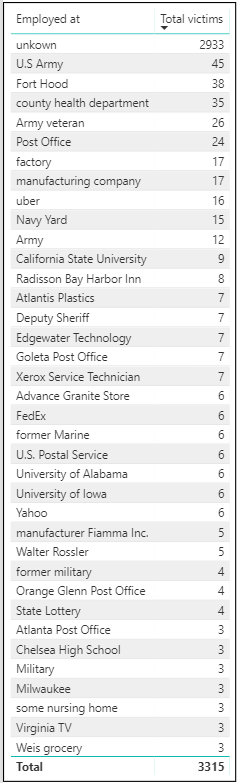
It comes as little surprise to me that the US army has among one of the highest victim counts. If they do train a psychopath, they have a real trained killer on their hands.
Then I did a word cloud for the stated target:
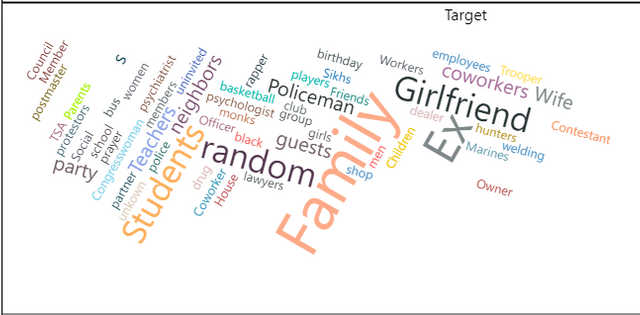
It looks like most killers tend to target students, family members, ex-girlfriends, and random people.
Then location:
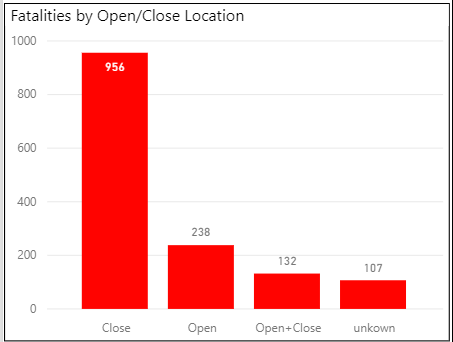
This just shows that most fatalities occur in a building rather than outside or in both areas.
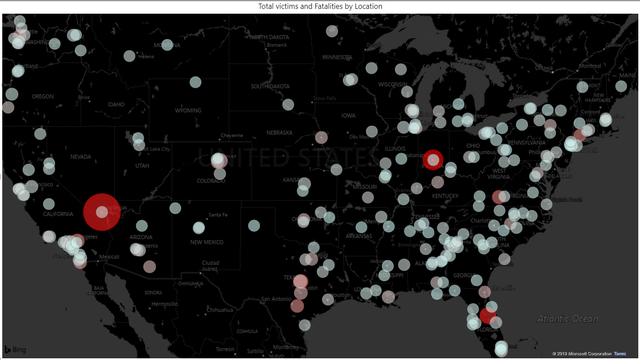
The map above shows, the larger the circle the more total victims there were and the redder it is, the deadlier the attack was – more fatalities. You can tell there is a lot of shootings in Alabama/Georgia, lots in California, lots in Washington. The area that seems to be lacking in shootings is the north Midwest. North Dakota, Idaho, Wyoming, Nebraska, ect has very few shootings. That’s possibly due to no real major population centers in those areas. But possibly other reasons too.
Summary:
From this very rough look into the mass shooting problem in America it looks as though most shooters are white, males, angry over ex-girlfriends or other life problems. They tend to murder the most people indoors. But they typically target people close in their lives – family, girlfriends, and coworkers. But some will often target random people as well. Overall, I think I’ve learned a fair amount from this little side project. I hope you have learned a thing or two and we can both talk about these issues from a slightly more educated position, one from data, not opinion.
I don't suspect you will get much support for this sort of information on steemit. But I will give you mine.
Well I appreciate it. I'm curious, why would I not get support for this information?
It points out things people don't want to hear.
That's a shame :/ I think it's important to know these things. I'm not really interested in trying to push any agenda. I just want to know the truth. Thanks for the input justtryme90.
I understand that. I voted for the post after all.