Small collection of chart thoughts

Good morning and happy trading, readers.
As the charts echo of medieval torture practices for crypto hodlers and blood is spilling in every direction, let me just gather some of my thoughts here.
Like I have stated a few times in the past and as many of you know, technical analysis is not an exact science. Of course, it can be used very accurately to nail some bounces, or map areas, often it also will leave you bedazzled like a deer in the headlights - just running you over.
Let it be noted that a proper technical analysis should be much more thorough - so lets call them my chart ramblings. So, my ramblings and thoughts.
Positioning - can we deduct something?
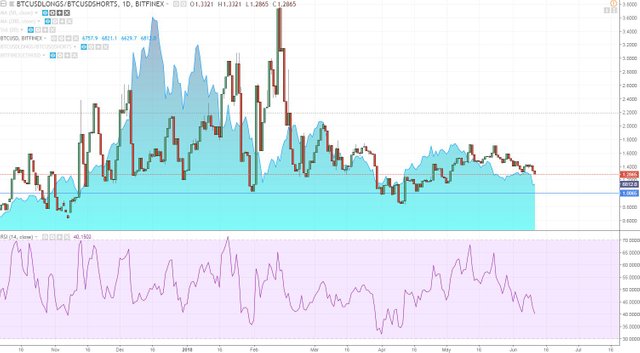
On the above chart, BTC longs vs shorts postioning on Bitfinex (candles) is overlaid with BTC price (blue area). It seems BTC price actually preceeds positioning a bit, so cannot precisely predict future movements, other than state that when shorts overtake longs, a new wave up could be in the cards. Currently, we've still holding more longs than shorts, with parity just below (horizontal line) - we'v come a long way from December.
Moving on, nothing to see here.
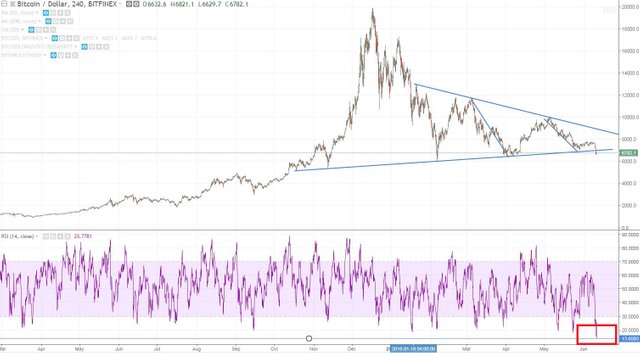
As you see, a breakdown is happening. Plotting these measured move legs on the chart points to 4500 or such and such. But what catches my eye is the Relative Strenght Index at 13. The last time we were this low on H4 chart, was in 2016, when Bitcoin was still trading around $350.
Lets take the timemachine and see what happened then:
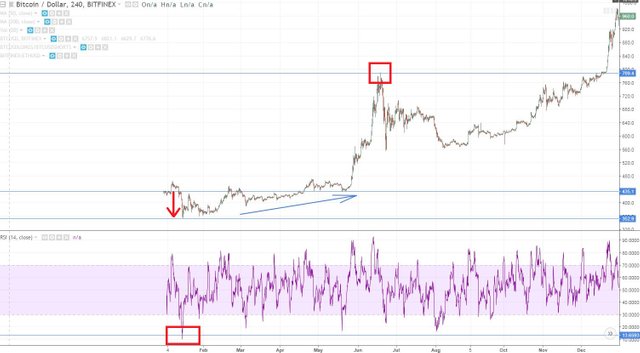
As you can see, the drop took us from 435 to 352, with RSI spiking as low as 10.xx and then staring a slow grinded ascent towards 789. The drop represents a 19% loss, but the slow grind towards 789 is a whopping 124% increase in price.
Summary
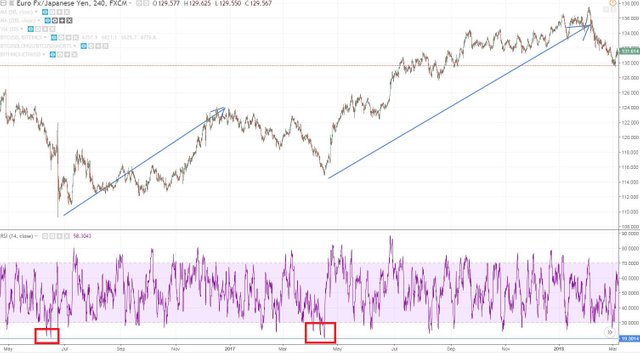
It doesn't mean a fucking thing. Just be aware that low RSI numbers often result in crazy long up legs. As an example I provide this EURJPY (euro-japanese yen) H4 chart, that I even managed to take some advantage of (not as much as I would have loved though).
Moving further. LTCUSD
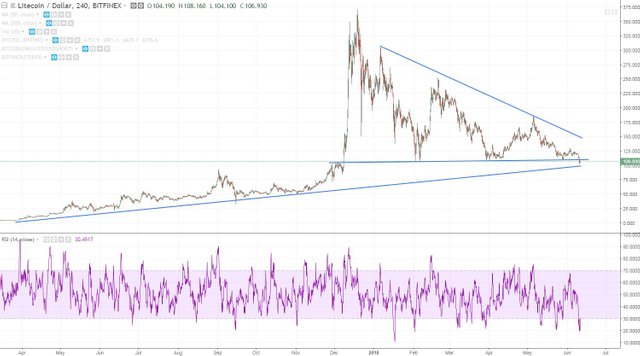
A bearish triangle breakdown. But perfect breakdowns tend to wrongfoot us traders, and an expression I took from Blake Morrow along my trading journey is "fake breakdowns create breakouts". It is not always the case, but if the stars align, what a perfect time to get involved.
Can't get by without STEEM.
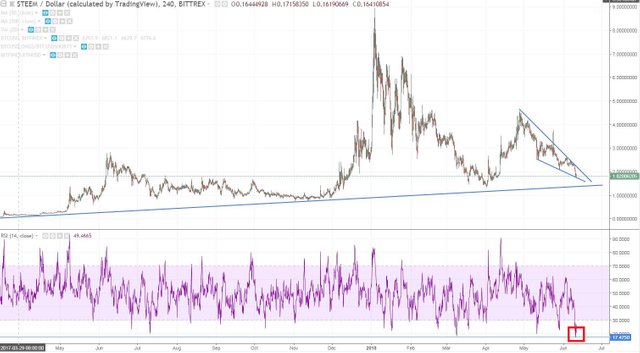
A perfect storm is brewing on the Steem chart with a nice bullish wedge and low RSI number.
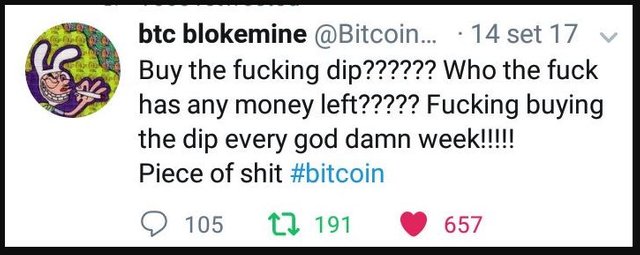
Keep in mind, as traders jump on board with a simple spark of positive news, the rallies will fizzle out, hurting buyers, hodlers even more. All up to a point, where despair is so common that no-one will ever believe that cryptocurrencies will ever pick up again.
See this tweet here:
None of the above is to be taken as trading advice, but i hope it gave you some ideas of your own. Keep calm, enjoy the ride!
Still not selling your vote to Minnowbooster to earn SBD? Do it now
Title image from pixabay


Are you looking for Minnowbooster, Buildteam or Steemvoter support? Or are you looking to grow on Steemit or just chat? Check out Minnowbooster Discord Chat via the link below.

buildTeam.io
I have little steem and some of them Selling to minnowbooster for daily earning. Minnowbooster is best.
Overall and according to the past 7 month i can see that my portfolio is on the downstream track.
inya:
“Tuhan menciptakan Anda untuk berada di dunia.
Anda berada di dunia untuk memenuhi misi tertentu. “
“You should be thankful for the journey of life. You only make this journey once in your life time.
Amazing creativity sir.
Outstanding post. 😍
Its really very good to read your article
if you get free time please have a look at my post☺💙
Thanks for sharing this post.