Is The "Ghost Of 2015" Back: Goldman Answers
Last week, JPMorgan spooked investors when looking at recent moves in Chinese markets, it concluded that "2018 Is Looking Increasingly Like 2015." Now, in a note seeking to address this issue (and to ease investor concerns) Goldman analyzes the similarities and differences between 2015 and 2018 to see if JPM is right, and if indeed the "ghost of 2015" is back.
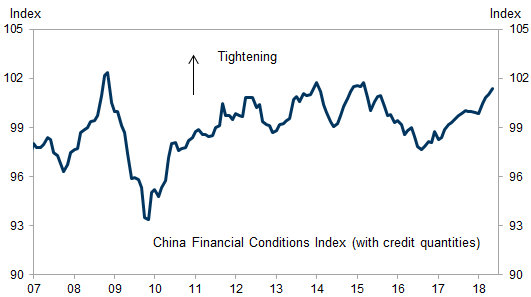
Goldman's note comes just days after a separate Goldman analysis in which the bank wrote that "the past week we met with investors in Guangzhou and Shenzhen, and the tone remains very negative" for one reason: most investors suddenly feel as if they have lost the backstop of the central bank, which until recently would never allow corporate bankruptcies, and suddenly - as part of the country's deleveraging campaign - is eager to take air out of the system, while at the same tine draining liquidity out of the system resulting in financial conditions approaching the tightest on record.
Fast forward to today, when going straight to the punchline, and perhaps not surprisingly considering the bank's still bullish outlook on China, Goldman has a relatively upbeat outlook, yet while it finds that many of the Chinese economy's indicators are more solid now than they were 3 years ago, the risk is from the outside, as "external headwinds seem more challenging now, characterized by strained Sino-US (trade) relations and the resulting Rmb volatility, solid but moderating global growth, a tightening Fed, and EM assets weakness."
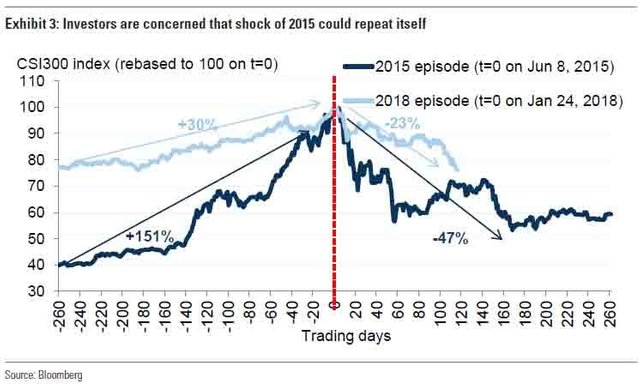
To be sure, the key reason for the comparisons between 2015 and 2018 is obvious: since its ytd high on Jan 24, China A shares (proxied by CSI300) have fallen 23% as of the close on July 6.
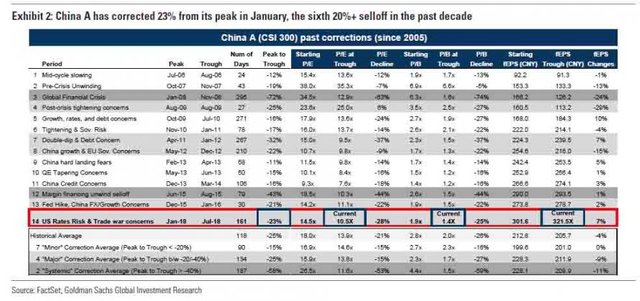
As Goldman calculates, this is the sixth 20%+ Chinese market correction (the benchmark for a 'Major' correction) over the past decade since the financial crisis, "prompting considerable investor concern that a market correction akin to the 2015 meltdown -- when China A shares lost 47% from June 2015 to Jan 2016 -- is just around the corner."
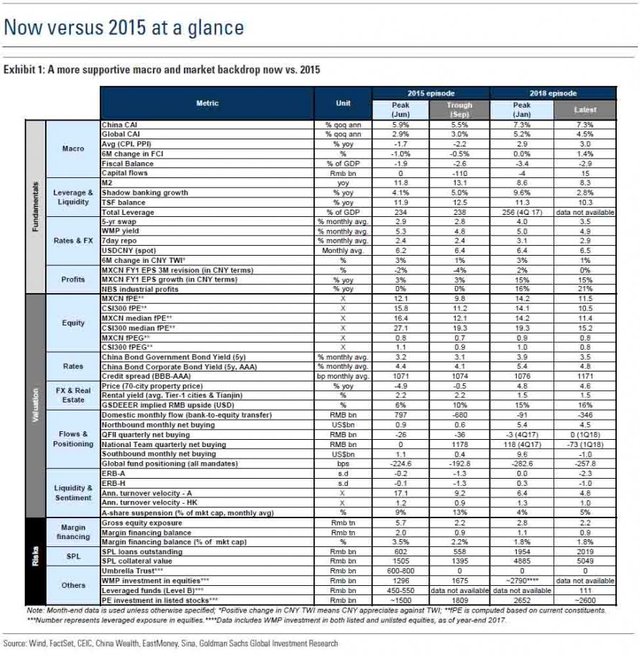
In its analysis, Goldman looks for similarities and differences between now and 2015 by comparing +40 macro/market variables and risk proxies to better frame views on China's A-share market. These are all shown below:
Here is how Goldman frames the key variances, starting with the macro and market growth backdrops which the banks says are healthier now than before; other favorable factors are:
- starting price levels, equity valuations, and risk appetite look significantly less extended in the current episode;
- financial leverage and liquidation risk relating to retail margin financing, WMP, stock-pledged loans, and other leverage products, appear more subdued and manageable this time around.
So far so good, however to Goldman the greater risk now compared to 2015 is that external headwinds seem more challenging now, characterized by strained Sino-US (trade) relations and the resulting Rmb volatility, solid but moderating global growth, a tightening Fed, and EM assets weakness.
Some further details, first on the macroeconomic context:
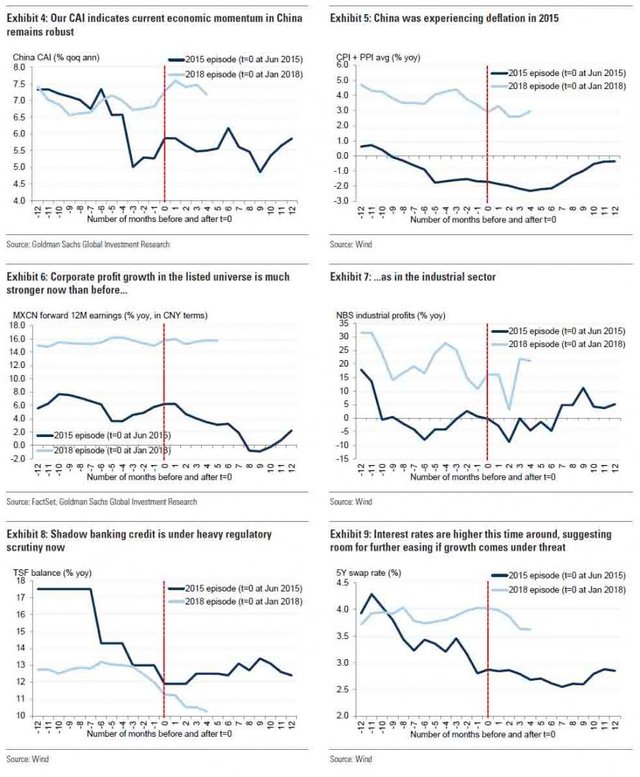
In 1H15, the Chinese economy was still suffering from deflation (average of CPI and PPI: -1.7% yoy) stemming from overcapacity issues domestically and lackluster global demand, as measured by our China and Global Current Activity Indicators (CAI). As a result, corporate earnings were lackluster, with NBS industrial profits and aggregate earnings of the listed universe growing merely 0.7% and 10%, respectively, in the first half of the year.
But in the current episode, we view the fundamental picture a lot more promising: Our China CAI has been growing on average 7.0% yoy in the first 5 months of the year, NBS industrial profits were up 17% yoy during the same period, and "New China" industries are still delivering impressive growth so far this year on our proprietary measure. In the equity market, corporate earnings were solid in 1Q, expanding 15% yoy. Forward-looking indicators also remain encouraging, with consensus earnings being revised up 0.4% since end-March and our top-down earnings model, which takes into account PMI and inflation proxies, pointing towards a strong 2Q.
Growth aside, the macro/policy environments also differ in the following aspects:
- Credit growth was markedly stronger in 2015 as the authorities were embarking on a major credit easing cycle to combat deflation and support growth (particularly after the market boom/bust) while in more recent times "deleveraging" and "controlling financial risk" are the key policy objectives that have been heavily emphasized by policymakers since the 19th Party Congress in October last year. The policy commitment is somewhat reflected in the downtrend in M2, the shadow banking component in TSF, and our economists' total money growth proxy since the beginning of the year;
- Monetary conditions were generally more accommodative in 1H15 based on our China Financial Condition Index (GS China FCI). In particular, price of money was easier back then (lower 7-day repo and swap rates), suggesting room for monetary policy easing in the current episode if growth comes under threat
How about in asset markets? Here too Goldman sees far less risk in the current regime:
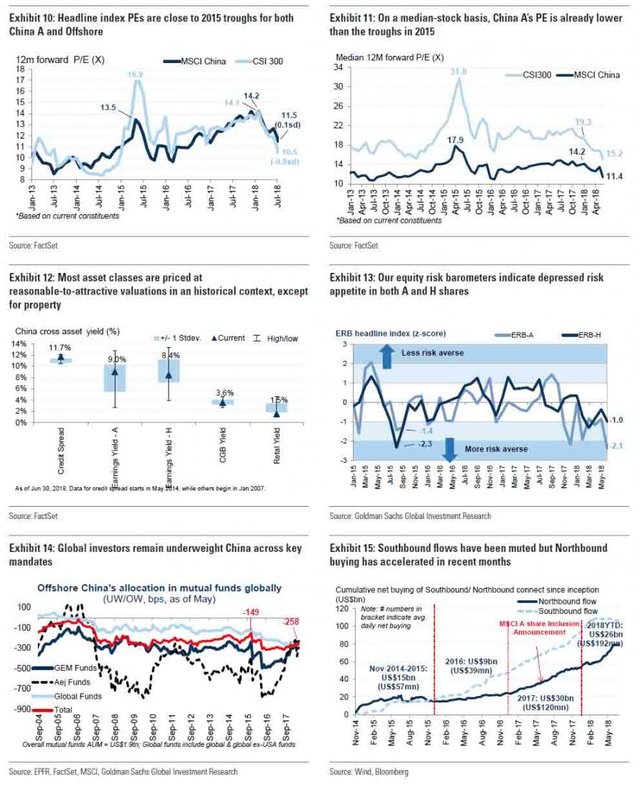
- Different starting points: China A shares had an impressive run from 2H14 to 1H15, rallying 65% and 151% 6m and 12m before the peak in June 2015. At its peak, China A shares had total market cap of US$11tn (US$308bn ADVT for June 2015), representing 107% of 2014 GDP, and 41% of US market cap at the time. From Jan 2017 to Jan 2018, while China A shares delivered 26% returns, it was underperforming its DM and EM peers.
- Equity valuations look more supportive now. Headline index P/E peaked at 17x in June 2015, but at only 14x in Jan 2018 (now at 10.5x), with the average/median PEs showing even larger gaps (median PE at 15x now vs 32x in 2015). The PEG ratios tell a similar narrative, hovering at 1.0x now vs. 1.3x then, suggesting corporate earnings growth is generally more attractively priced than 3 years ago.
- Our equity risk barometer (ERB) for China A, which we view as a comprehensive sentiment indicator, which encompasses 16 discrete variables such as turnover velocity, market volatility, and cross-asset correlations, suggests that risk appetite wasn't even at extreme levels at the onset of the drawdown (ie, it was in neutral territory in early Jan) but is currently at very depressed levels not seen since the GFC meltdown a decade ago.
Next, Goldman looks at another topic that has gained prominence in recent weeks: the threat of market leverage and forced liquidation risks. Here too, Goldman finds mostly favorable signs, focusing initially on the leverage profile of A shares, as it was the key culprit for the 2015 market dislocation.
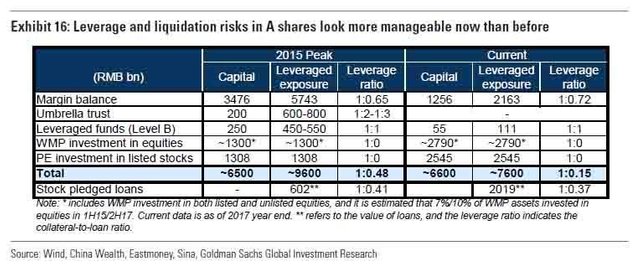
- Overall, we'd argue that the current systemwide leverage ratio (1:0.15) is substantially lower than the peak in 2015 (1:0.5), although market risk may have shifted towards redemption this time around, from margin-unwinding back in 2015, due to the crackdown on the shadow banking credits. Official margin loan balance has more than halved from the peak in June 2015 (Rmb2.3tn) to Rmb0.9tn now. Margin financing balance accounted for 3.5% of listed market cap in June 2015, but is only at 1.6% at present. Importantly, the effective leverage offered by this channel has been quite measured (and tightly regulated), at around 1 to 0.7 (i.e. $70 of loans on $100 of capital), with still-healthy guarantee ratios of around 240% as of June. We estimate that equity prices would need to fall another 26% from current levels to trigger margin call for the average margin financing positions.
- Brokers' margin financing aside, investors are concerned about other leveraged exposures which are not captured in the brokers channel, notably leveraged funds and wealth management products (WMP). Aggregating our bottom-up and our banks team's estimates, we see these vehicles combining to Rmb2.8tn worth of equity holdings, representing 5% of listed A-share market cap. However, our understanding is that, unlike those investing in the bond market, most of the equity-oriented WMPs are unlevered and hence they are more likely subject to redemption risk than margin call risk.
- Stock pledged loans (SPL) have been one of the key topical concerns among investors in the context of forced selling in A shares. In sum, we see limited liquidation (and systemic) risk in this area, because: (1) the outstanding value of pledged shares and loans is Rmb5.0tn and Rmb2.0tn respectively, 10% and 4% of A-share listed market cap; (2) Loan-to-value (LTV) ratios are generally fairly conservative for SPL (37% on average over the past 3 years); (3) We estimate that only 31% of the outstanding pledged shares/loans are facing margin call risk, representing 3%/1% of market cap; (4) it would require another 20% fall in equity prices to push the margin call risk to 50% of total; and (5) According to Bloomberg, window guidance from regulatory bodies has been issued to brokers to reduce the risk of unordered liquidation, even when a margin call is triggered.
- Other OTC leverage products: "Hidden" OTC leverage was perhaps the reason why the correction in 2015 was manifested in such a fast and furious fashion. These OTC products were not tightly regulated and some of them were able to offer as high as 10X leverage to investors (e.g. P2P financing), thereby amplifying the up and down moves of the 2015 boom/bust cycle. At their peak, these products in aggregate could add another Rmb1tn-Rmb1.5tn levered exposure on top of brokers' margin financing. At the moment, highly-levered OTC products still exist (e.g. P2P financing and online financing platforms) but their scale is likely to be a fraction of that in 2015, based on our channel checks.
And visually:
Summarizing the above observations, Goldman notes a common theme: the domestic dynamics look to be in better shape now than in the last boom/bust episode, with the exception of the determination by policymakers to restrain shadow banking credits which has provoked redemption pressures for certain WMPs with low (or no) leverage.
And yet, one risk remains: namely the external situation, which is arguably more challenging for China this time around, "featuring continued and possibly escalating US-China trade tensions, moderating global growth momentum (which tends to bode well for the Dollar), normalizing US monetary policy, and weak EM assets performance." Which predictably brings us to the following hedge in the context of Goldman's broader "buy" rating on Chinese stocks:
As such, while we maintain our positive (Overweight) stance on Chinese stocks, we would take a selective implementation approach to better navigate the near-term volatility.
Goldman's conclusion: "investors will remain jittery over China stocks until there is greater clarity about resolution to ongoing heightened trade tension, and/or more pronounced policy responses in terms of policy loosening, FX stabilization, and perhaps less likely, marginal relaxation of financial regulation tightening."
What Goldman did not say, at least not explicitly, is that while the domestic situation now may be better, the risk for the Chinese stock market - and economy - is that Trump continues to aggravate China's external financial links, supply-chains and trade ties with ever escalating protectionist salvos. Which may be the reason behind Trump's trade war in the first place, and why contrary to China's denials, Trump holds the leverage over Beijing, as a few more pushes and Chinese stocks may suffer from a waterfall liquidation, because no matter how strong the domestic profile, there is only so much pain China can sustain from the US.
And with the Shanghai Composite sliding the under 100 points from the post 2015 lows, it may not take much more pressure to force this key backbone of China's wealth effect to finally snap, potentially leading to a shockwave across China's other asset classes and, ultimately, a sharp enough economic slowdown that forces Beijing to yield.
https://www.zerohedge.com/news/2018-07-09/ghost-2015-back-goldman-answers
