Hanes Brands (HBI): Terminal End of a Correction?

SUMMARY
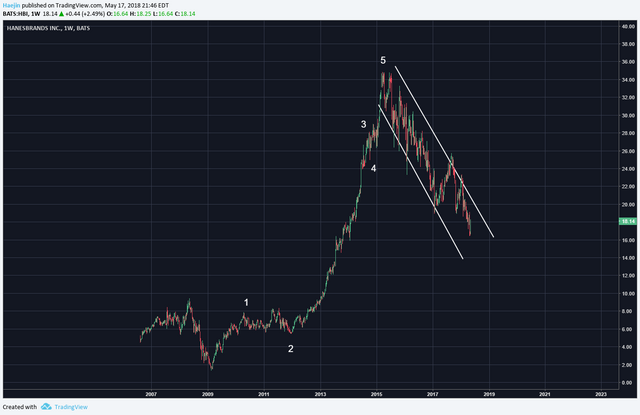
When is the best time to buy? At the terminal end of a correction. Take a look at the Hanes Brands (HBI) chart. I made a very nice 3 wave extended impulse wave sequence. After wave 5, the correction didn't waste any time. Price has been correcting while traveling within a channel and the key question is: What's next?
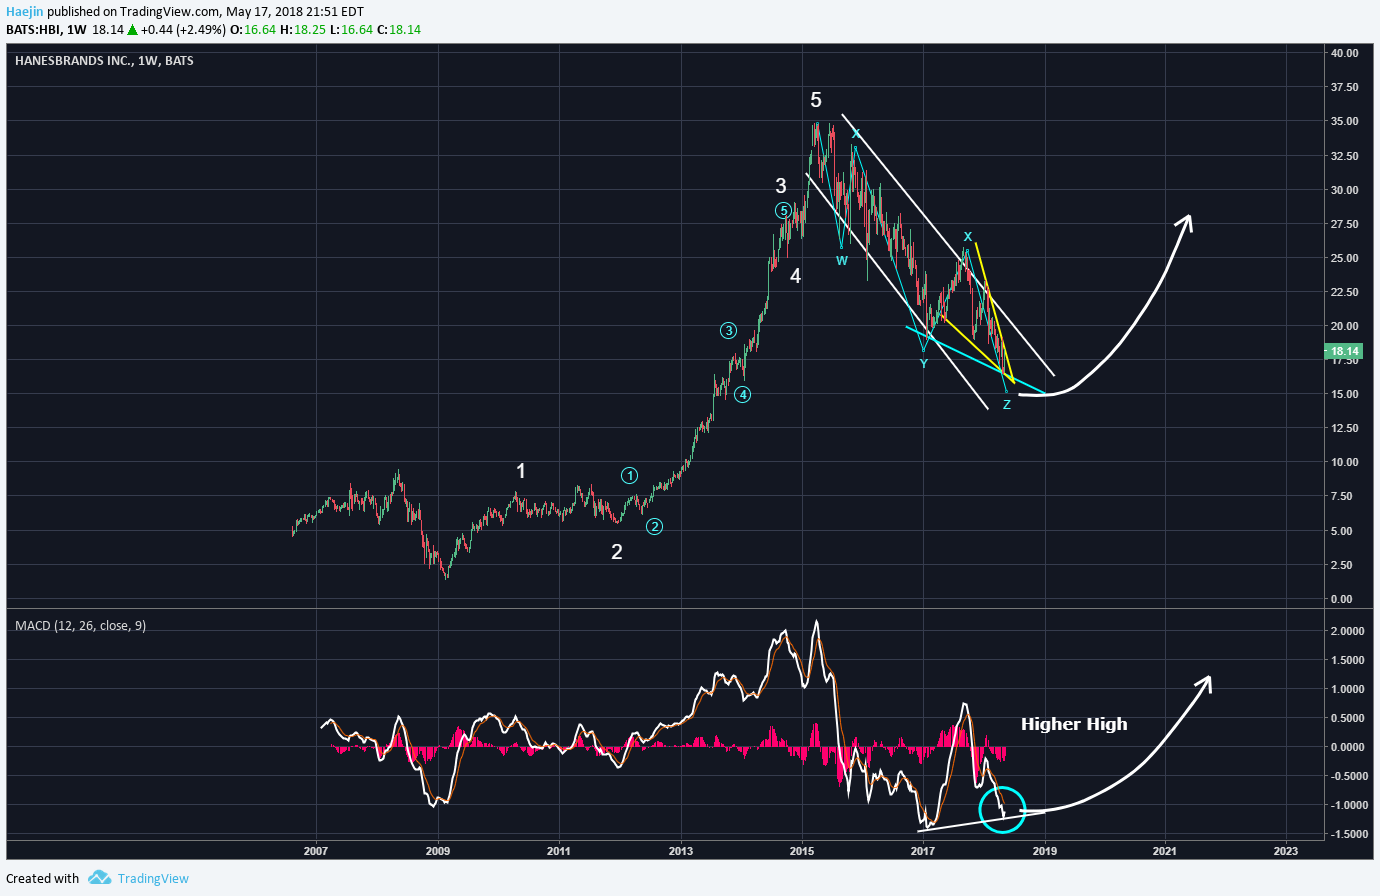
The subwaves qualify the higher degree of trend waves pretty well. The correction looks to be a wxyxz (blue) sequence. Note also the downward wedge pattern (yellow) and price should break out of this pattern as well. The MACD has been making higher lows while price has been putting in lower lows. I believe a price turn to the upside is coming.
Legal Disclaimer: I am not a financial advisor nor is any content in this article presented as financial advice. The information provided in this blog post and any other posts that I make and any accompanying material is for informational purposes only. It should not be considered financial or investment advice of any kind. One should consult with a financial or investment professional to determine what may be best for your individual needs. Plain English: This is only my opinion, make of it what you wish. What does this mean? It means it's not advice nor recommendation to either buy or sell anything! It's only meant for use as informative or entertainment purposes.
Please consider reviewing these Tutorials on:
Elliott Wave Counting Tutorial #1
Elliott Wave Counting Tutorial #2
Elliott Wave Counting Tutorial #3
Laddering and Buy/Sell Setups.
Laddering Example with EOS
Tutorial on the use of Fibonacci & Elliott Waves
@haejin's Trading Nuggets
Essay: Is Technical Analysis a Quantum Event?
Follow me on Twitter for Real Time Alerts!!
Follow me on StockTwits for UpDates!!
--
--


This is the best trader tool: https://goo.gl/rzgsqe
Hi men im new in this of the crypto currency stuff your analisis are very interesting can i ask u where do u get those charts? pliz
(QTUM Dapp) LUNA Coin FREE AIR DROP
AIRDROP Quantity: 1000
https://t.me/LunaInviteBot?start=edp55pxi9o000o9g
tradingview.com
This haejin post has been downvoted, it is a @flagtarget.
READ: Resteeming @haejin's 8th 9th and 10th post of the day as target to be flagged.
They resteem 3 of @haejin's posts a day, and we concentrate our efforts on removing the potential rewards from those three.
Then @flagfund pays "The Braves" who flag those 3 posts every day, as you can see their posts are doing quite well.
Thanks for the change in analysis haejin where you've included some of the key stocks...very interesting stuff my friend...cheers
While I'm not very interested in the actual individual stocks, It has been interesting to me to see graphs in different phases of development. The crypto market seem to move in a very similar fashion and all at the same time. The stocks seem to be in all phases of the 5 wave upcycles and corrections.
Good evening, I'll follow you and vote for you in the publication, if you can help me I'll thank you.
https://steemit.com/nature/@isaherrera21/horizon
Good analysis, it may help traders to gain profits while doing trading.