Omnicom Group (OMC): Be Aware of These Fractals

SUMMARY
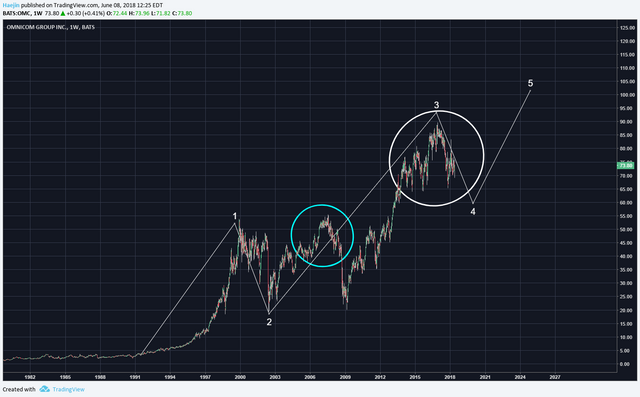
The below chart of Omnicom Group (OMC) shows that an impulse is in progress. However, fractals are always very good analogous tools for good directional confirmation of price. To that end, the blue and the white circles harbor a fractal. Can you discern it? Which pattern is it?
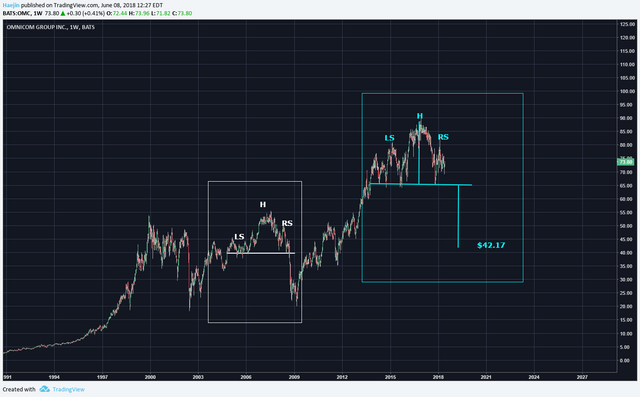
The white box shows the Left Shoulder (LS), Head (H) and Right Shoulder (RS) features of a Head & Shoulder Top pattern. In this fractal, price collapsed promptly below the neckline. The blue box shows the developing fractal of the same Head & Shoulders. The LS and H are complete with the RS in progress. IF price declines below the horizontal blue line, then the minimum price travel would be $42.17. IF this target is reached, it would also invalidate the above Elliott Wave count.
Legal Disclaimer: I am not a financial advisor nor is any content in this article presented as financial advice. The information provided in this blog post and any other posts that I make and any accompanying material is for informational purposes only. It should not be considered financial or investment advice of any kind. One should consult with a financial or investment professional to determine what may be best for your individual needs. Plain English: This is only my opinion, make of it what you wish. What does this mean? It means it's not advice nor recommendation to either buy or sell anything! It's only meant for use as informative or entertainment purposes.
--


__
I recommend a very interesting mater
Yeah I also believe that market will raise .
Thank you.
THX For your Infos here!
Great Work!!!!