What Does Cotton Have To Do With Hurricane Florence???

Cotton has been used in textile production for 1000s of years and used in providing thousands of products like apparel, but even gunpowder. The US, India and China produce over 65% of cotton used by citizens of the world. A bale of cotton weighs about 500 lbs and can produce over 1000 T-shirts. Harvesting cotton begins in July until late November and is grown in about 15 states such as, but not limited to North Carolina, South Carolina, Tennessee and Virginia. But the top producing states are the following:
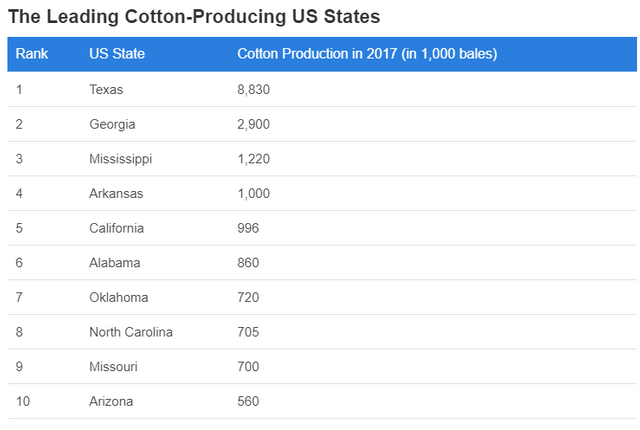
Georgia produces 18% of cotton in the US, which is also its leading crop. The climate and environment in Georgia facilitate the high-quality cotton growth which textile mills worldwide desire this product. Georgia has high rainfall but the soil cannot hold water for long, therefore, cotton is the best crop for the conditions. Another factor that favors this state is a long growing season and high temperatures. Since 1965, farmers have been funding the Georgia Cotton Commission which, in turn, invest in research, education, and promotion of farmers. This commission also advances the interests of farmers in every way possible, making sure that producers remain profitable even with fluctuating cotton prices.
Although Hurricane Florence has been reduced from a Category 4 to a Category 2, it’s expected to just linger on land. Simultaneously a good amount of acres of cotton are only now starting to defoliate. The more Florence lingers on land, the rain, wind and floods are going to adversely affect the cotton yield. Like anything we buy and sell, even in trading, what moves price is supply and demand. Thus, lets go to the charts to see how Florence might affect the price of cotton.
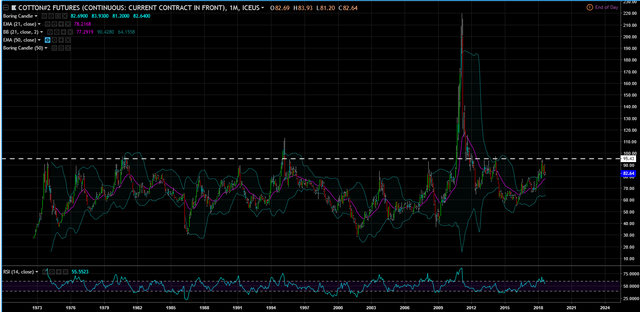
I have never looked at a cotton chart before, so lets zoom really out. Big, big picture the $95 level doesn’t like Cotton. Since 1973 this level has served as resistance.
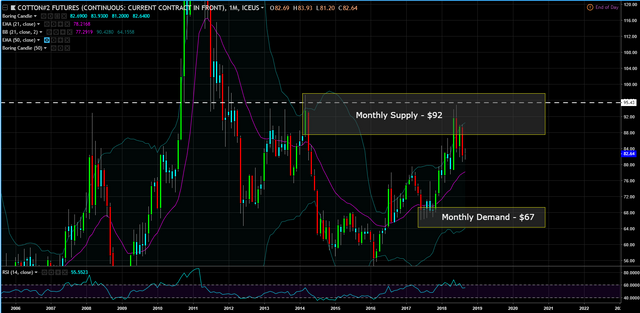
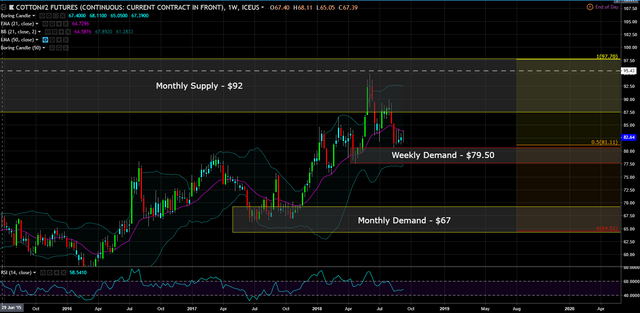
Monthly Chart (Curve Time Frame) - monthly supply is at $92 and the monthly demand is at $67.
Weekly Chart (Trend Time & Entry Time Frame) – the trend is still up, but there is a really nice weekly demand level at $79.50.
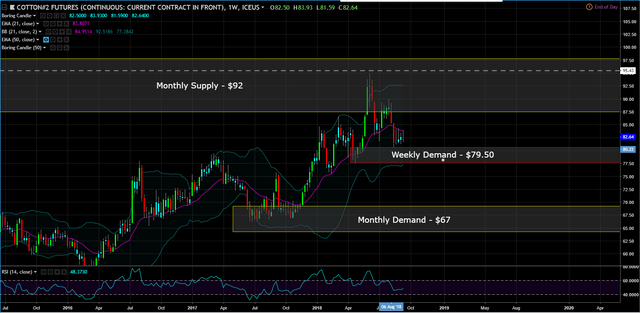
If I break the curve up into quadrants, the weekly demand is below the 50% line. This mean this trade set-up is OK to take to the long side.
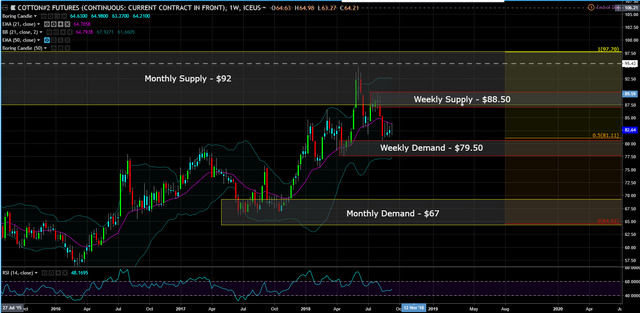
If the level was above 50%, this would imply the reward might be short lived due to the monthly supply above. The chart suggests price will bounce off the weekly supply at $79.50 with a target at $89.
This post is my personal opinion. I’m not a financial advisor, this isn't financial advise. Do your own research before making investment decisions.

Published on

by rollandthomas

I love your titles man...I just have to click on your posts. ;-)
good information
Thanks @luisjls
Thanks @workin2005. Trading is meant to be boring, so I'm just trying to spice things up a bit.
His titles are as good as his posts... Both are excellent and educational.
Congratulations @rollandthomas! You have completed the following achievement on the Steem blockchain and have been rewarded with new badge(s) :
Click on the badge to view your Board of Honor.
If you no longer want to receive notifications, reply to this comment with the word
STOP