$NEO Price Analysis
$NEO Price Analysis

Disclaimer: This article is not financial advice. The author is not a financial advisor and this article was not paid for.
For more information like this, join/follow our Telegram, Discord, Steemit, Reddit, and Twitter!
$NEO Price Analysis
The price of $NEO against $BTC has been getting absolutely pummeled in the last 6 months:
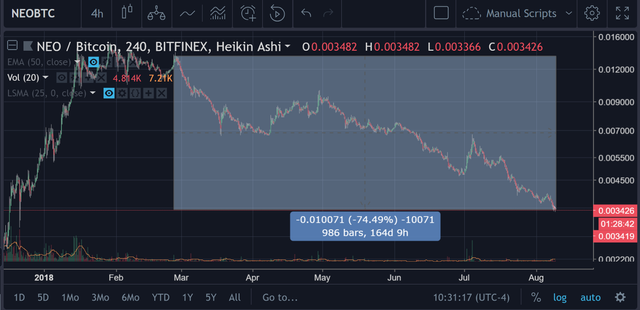
Depreciation of 74.49% against $BTC — aka its getting its ass kicked.
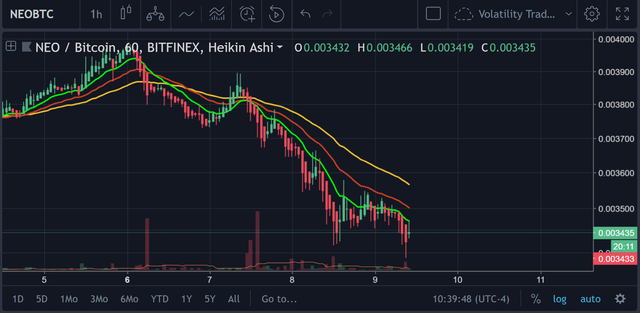
Here it is in the last 30 days:
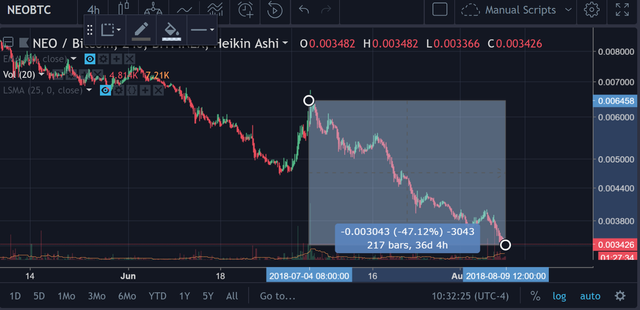
Reminder, that this is against $BTC!
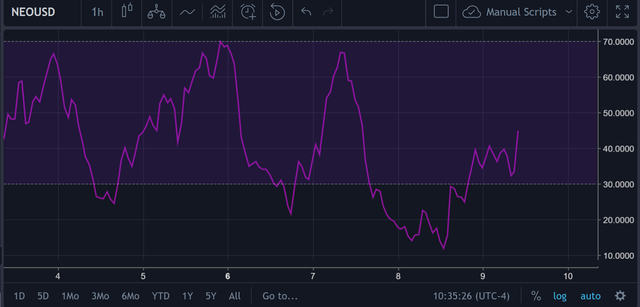
Now, let’s see how it moves on the USDT chart.
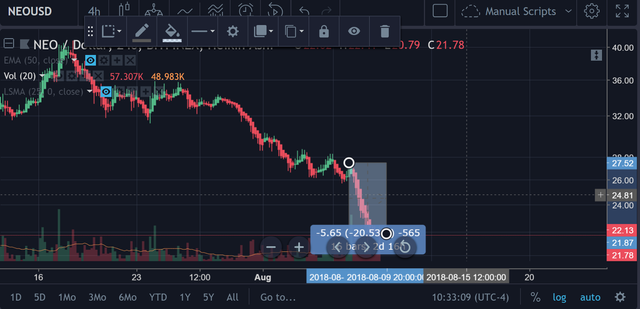
- 20% in the last 2 and a half days.
Balance of Power (My Personal Version of the Signal)
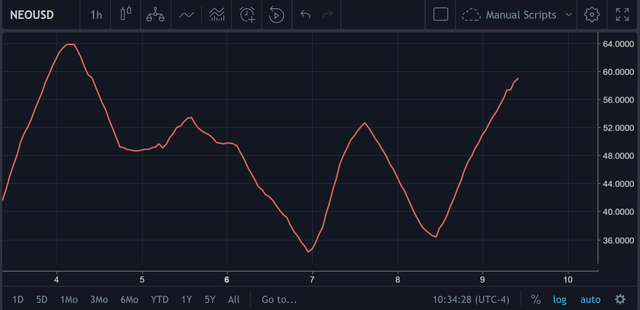
It’s straight upward for $NEO on the 1H chart, which is admirable.
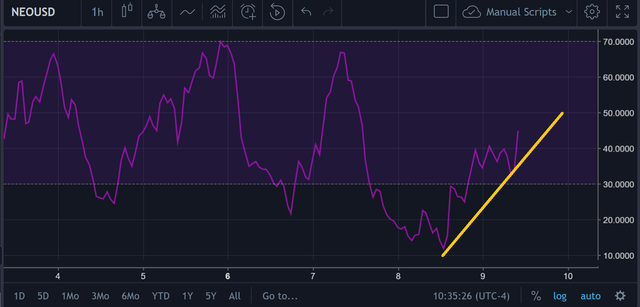
Let’s check out the RSI for the 1H chart to see if there is any type of scalp opportunity that we can pull out of here!
Relative Strength Index (14)
Clear divergence can be seen on this chart on the 1H, below is the illustration of said divergence.
Support Point
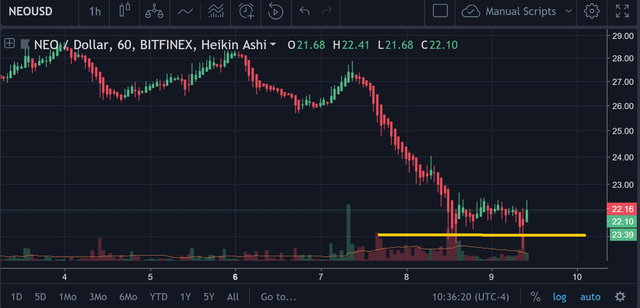
Yellow Line = support (obviously) on the 1H chart.
It’s holding very solid at the moment. Been tested a lot. Perhaps this is a time where the price for $NEO can finally bounce.
As you see on that very last candle on the end, the price increase has occurred.
No telling whether the price is going to hold here on the $BTC pairing on the 1H though — especially if the $BTC continues to hold.
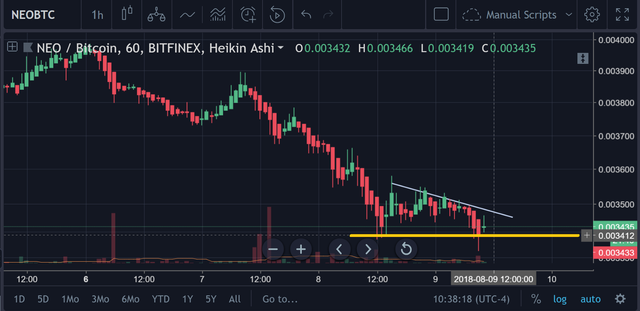
EMA Indicators
EMA-12, 26, and 50 are all directly overhead (in that order as well on the chart above).
While this is only the 1H chart (which means that it won’t be that significant), this is still something worth noting and a barrier to a serious increase in the $BTC price of $NEO.
Conclusion
Can’t really see a strong reason for entry on this project, to be honest.
Perhaps there will be a slight increase in the short-term, but nothing worth putting an investment in until the price truly breaks through those three EMA indicators that were shown above and that the divergence that we saw on the RSI has spread out to other indicators.
@proofofresearch, I do not understand anything written
Time to learn the basics then.