Goal of the histogram - Digital photography
The goal of the histogram
You can recall any photo taken to show on the LCD screen of the camera. By doing this you will also be able to see the histogram by pressing the info button a few times until the histogram appears.
The histogram indicates if a photo is under-or overexposed.
The histogram will look like this:
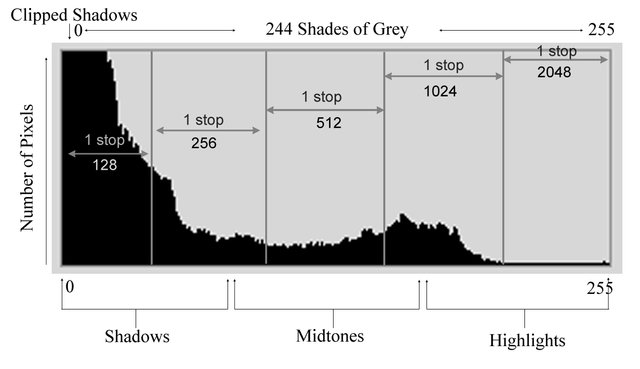
This is a plain graph that indicates all the light and dark spaces on a photo.
These values will be shown underneath the graph, from the darkest to the lightest parts on the photo.
The vertical axis of the histogram shows the amount of pixels.The horizontal axis of the histogram shows the brightness of the pixels, from black (left side of the histogram) to white (right side of the histogram) and in the middle of the histogram it will show the grey pixels.

Where to find the histogram on the dSLR cameraIf you use a Canon dSLR camera, you must have the photo on the LCD screen first. Press the DISP button twice and the histogram will show. Press the DISP button again to go back to the previous screen.
In you use a Nikon camera, you must press the Up and Down buttons near the OK button to see the histogram.
Also refer to your manual you got when buying the camera
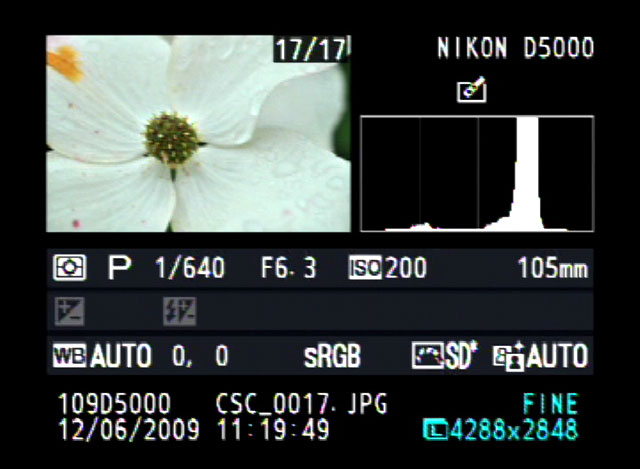
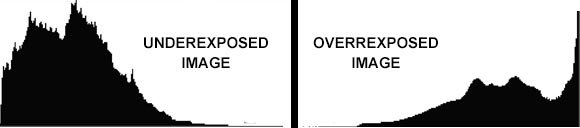
A photo that is underexposed will look like this on a histogram:
Underexposed and overexposed example
To little light reached the sensor because of a fast shutter speed or a small aperture. If this photo is printed, all the detail in the darker areas will be lost.
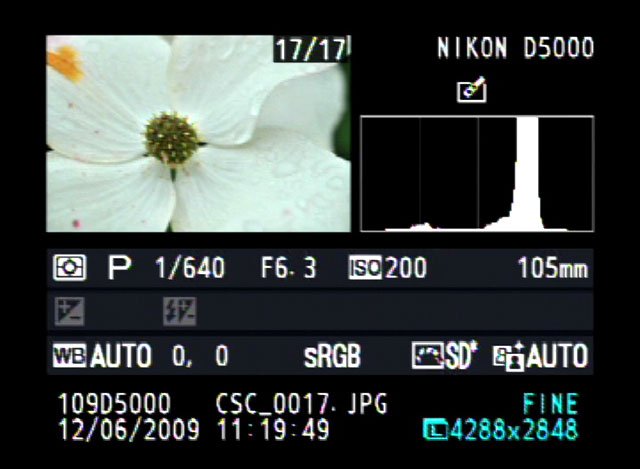
A photo that is over exposed will look like this on a histogram:
This photo is overexposed because too much light reached the sensor. Areas that are suppose to show detail will be overexposed.
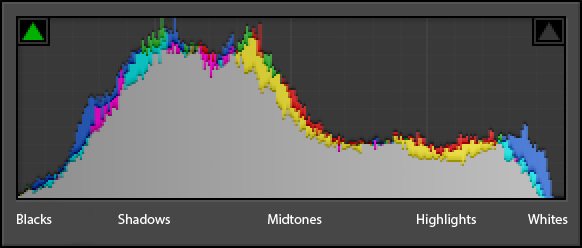
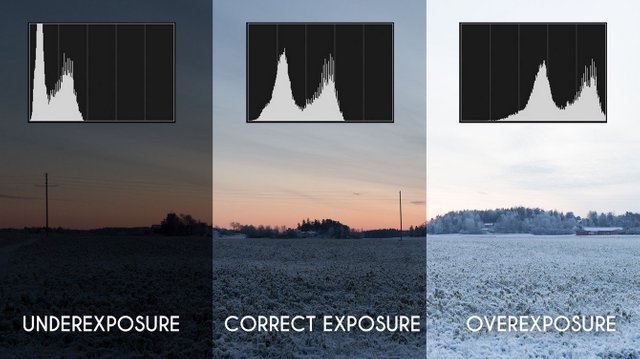
Photos that are correctly exposed will look like this on a histogram:
The histogram of correct exposure must match the shadows in your photo, a darker image will show clock-form to the right, and a lighter image will show clock-form to the left. The above pictures shows an image that is correctly exposed, both side falls evenly to the black and white side, which will give an image of full tonal range.
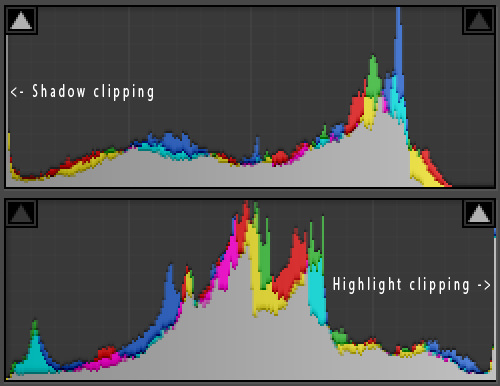
Clipped images

A histogram will indicate the above. What happens here is that the histogram will indicate which areas in the photo is too dark, too light or both.
It looks like pixels stuck together on the side of the histogram.
An area on the photo, which is too light, is difficult to change with the help of software programs. In darker photos the details can be saved.
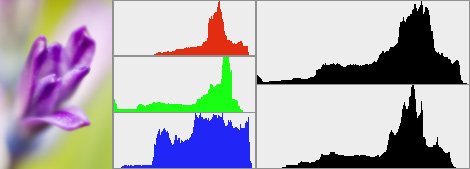
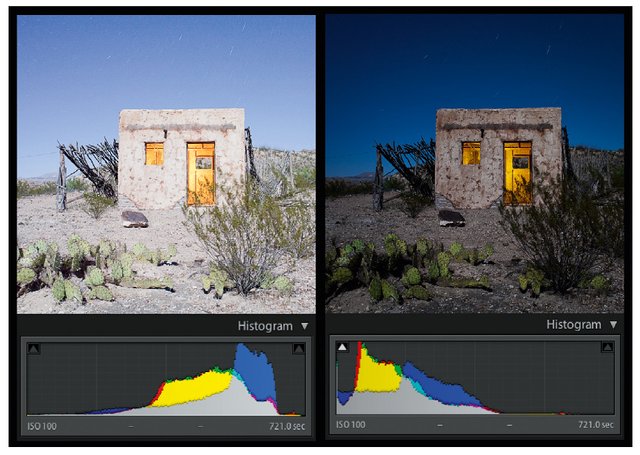
A color histogram:

Color histograms have 3 separate histograms. One for each of the R, G and B channels. This helps to indicate the correct exposure on a photo immediately.
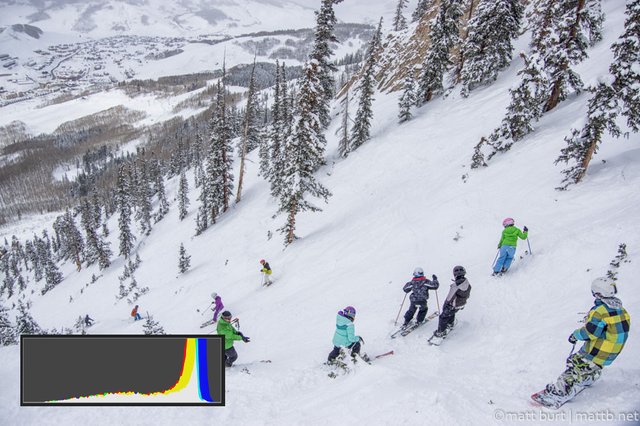
There are times where a photo will be over-or under exposed:
- where a photo(high key) was taken in the snow
- where a photo was taken during the night (low key)
Enough light is needed to ensure the correct exposure of a photo.
Too much light means an over-exposed photo
Too little light means and under exposed photo
The amount of light that enters is determined by the f-stop, shutter speed and ISO.

Go here https://steemit.com/@a-a-a to get your post resteemed to over 72,000 followers.